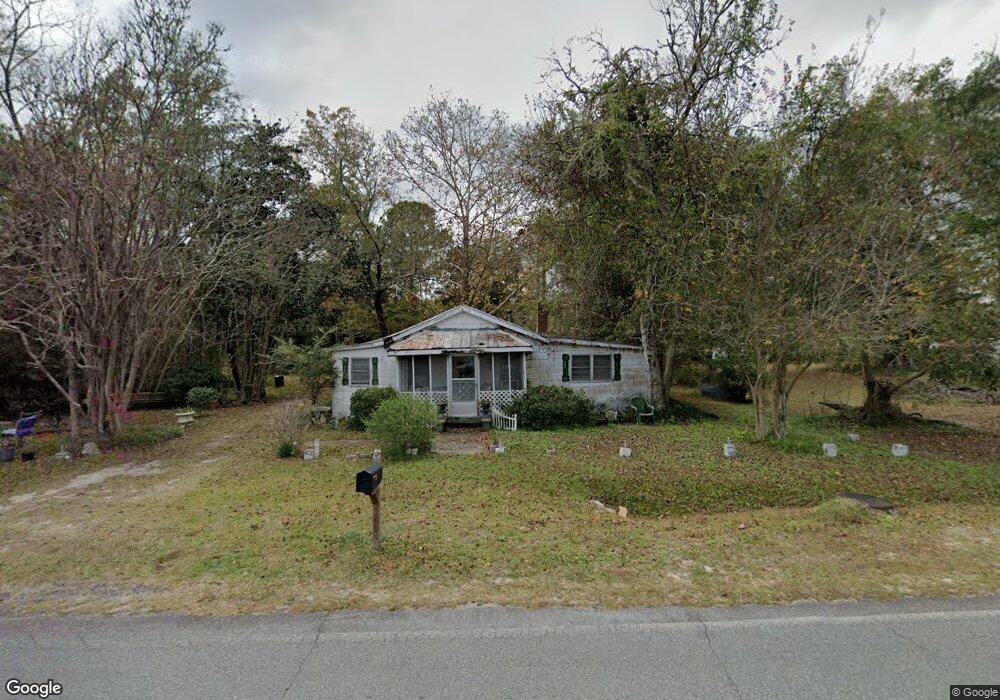
539 Ash Branch Rd Pembroke, GA 31321
Estimated Value: $98,000 - $303,000
4
Beds
1
Bath
1,581
Sq Ft
$138/Sq Ft
Est. Value
About This Home
This home is located at 539 Ash Branch Rd, Pembroke, GA 31321 and is currently estimated at $218,773, approximately $138 per square foot. 539 Ash Branch Rd is a home located in Bryan County with nearby schools including Lanier Primary School, Bryan County Elementary School, and Bryan County Middle School.
Ownership History
Date
Name
Owned For
Owner Type
Purchase Details
Closed on
May 1, 1997
Sold by
Mikell Maude
Bought by
Mikell Joe Louis
Current Estimated Value
Purchase Details
Closed on
May 1, 1950
Create a Home Valuation Report for This Property
The Home Valuation Report is an in-depth analysis detailing your home's value as well as a comparison with similar homes in the area
Home Values in the Area
Average Home Value in this Area
Purchase History
| Date | Buyer | Sale Price | Title Company |
|---|---|---|---|
| Mikell Joe Louis | -- | -- | |
| -- | -- | -- |
Source: Public Records
Tax History Compared to Growth
Tax History
| Year | Tax Paid | Tax Assessment Tax Assessment Total Assessment is a certain percentage of the fair market value that is determined by local assessors to be the total taxable value of land and additions on the property. | Land | Improvement |
|---|---|---|---|---|
| 2024 | $2,449 | $42,524 | $11,760 | $30,764 |
| 2023 | $1,419 | $30,820 | $11,760 | $19,060 |
| 2022 | $1,008 | $28,624 | $11,520 | $17,104 |
| 2021 | $1,046 | $29,224 | $11,520 | $17,704 |
| 2020 | $1,010 | $28,944 | $11,240 | $17,704 |
| 2019 | $1,024 | $28,112 | $11,240 | $16,872 |
| 2018 | $1,030 | $28,112 | $11,240 | $16,872 |
| 2017 | $1,020 | $29,676 | $11,240 | $18,436 |
| 2016 | $1,010 | $28,996 | $11,240 | $17,756 |
| 2015 | -- | $28,476 | $11,240 | $17,236 |
| 2014 | -- | $28,672 | $11,240 | $17,432 |
Source: Public Records
Map
Nearby Homes
- 802 Ash Branch Rd
- 3302 Georgia 67
- 001 Georgia 67
- 0 Fabled Ln Unit LOT 4
- 40 Circle Dr
- 25 Hamilton Ct
- 55 Kayton Ct
- 168 Rogers Rd
- 0 Warnell St Unit 10512255
- 182 Rogers Rd
- 219 N College St
- 226 Strickland St
- 231 Warnell St
- 301 Park Ave
- 1275 Camellia Dr
- 142 Bill Brown Rd
- 0 Highway 119 Unit SA330839
- 0 Hwy 119 N Unit 298325
- 0 U S Highway 280
- 0 Highway 67 Unit 10616006
- 47 Harry Hagan Rd
- 0 Harry Hagen Rd Unit 10103288
- 467 Ash Branch Rd
- 59 Harry Hagan Rd Unit 6
- 59 Harry Hagan Rd
- 569 Ash Branch Rd
- 120 Jones St
- 407 Ash Branch Rd
- 568 Ash Branch Rd
- 108 Jones St
- 92 Jones St
- 0 Circle Dr
- 0 Circle Dr Unit 246720
- 592 Ash Branch Rd
- 130 Harry Hagan Rd
- 522 Ash Branch Rd
- 614 Ash Branch Rd
- 688 Strickland Street Extension
- 107 Jones St
- 133 Harry Hagan Rd