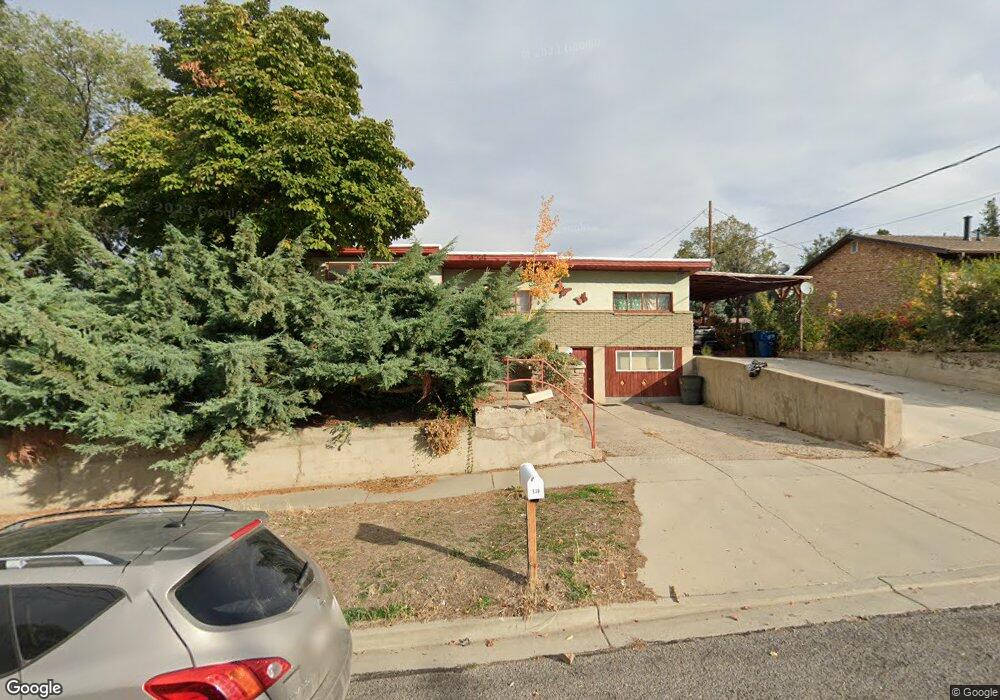
539 E 200 S Payson, UT 84651
Estimated Value: $446,000 - $473,000
4
Beds
2
Baths
1,985
Sq Ft
$231/Sq Ft
Est. Value
About This Home
This home is located at 539 E 200 S, Payson, UT 84651 and is currently estimated at $458,576, approximately $231 per square foot. 539 E 200 S is a home located in Utah County with nearby schools including Park View Elementary, Mt. Nebo Middle, and Payson High School.
Ownership History
Date
Name
Owned For
Owner Type
Purchase Details
Closed on
Jan 30, 2020
Sold by
Francom Mark
Bought by
Francom Mark
Current Estimated Value
Home Financials for this Owner
Home Financials are based on the most recent Mortgage that was taken out on this home.
Original Mortgage
$216,300
Interest Rate
3.7%
Mortgage Type
New Conventional
Purchase Details
Closed on
Dec 10, 2018
Sold by
Francom Mark David
Bought by
Francom Mark
Home Financials for this Owner
Home Financials are based on the most recent Mortgage that was taken out on this home.
Original Mortgage
$212,250
Interest Rate
4.8%
Mortgage Type
New Conventional
Create a Home Valuation Report for This Property
The Home Valuation Report is an in-depth analysis detailing your home's value as well as a comparison with similar homes in the area
Home Values in the Area
Average Home Value in this Area
Purchase History
| Date | Buyer | Sale Price | Title Company |
|---|---|---|---|
| Francom Mark | -- | Trident Title Ins Agcy Llc | |
| Francom Mark | -- | Title One | |
| Francom Mark David | -- | Title One |
Source: Public Records
Mortgage History
| Date | Status | Borrower | Loan Amount |
|---|---|---|---|
| Previous Owner | Francom Mark | $216,300 | |
| Previous Owner | Francom Mark | $212,250 |
Source: Public Records
Tax History Compared to Growth
Tax History
| Year | Tax Paid | Tax Assessment Tax Assessment Total Assessment is a certain percentage of the fair market value that is determined by local assessors to be the total taxable value of land and additions on the property. | Land | Improvement |
|---|---|---|---|---|
| 2025 | $2,390 | $455,600 | $144,100 | $311,500 |
| 2024 | $2,390 | $243,265 | $0 | $0 |
| 2023 | $2,419 | $246,895 | $0 | $0 |
| 2022 | $2,551 | $256,025 | $0 | $0 |
| 2021 | $2,115 | $340,500 | $105,900 | $234,600 |
| 2020 | $2,019 | $318,000 | $96,300 | $221,700 |
| 2019 | $1,753 | $283,100 | $83,100 | $200,000 |
| 2018 | $1,613 | $251,100 | $70,000 | $181,100 |
| 2017 | $1,478 | $123,695 | $0 | $0 |
| 2016 | $1,361 | $113,135 | $0 | $0 |
| 2015 | $1,395 | $115,225 | $0 | $0 |
| 2014 | $1,373 | $114,235 | $0 | $0 |
Source: Public Records
Map
Nearby Homes