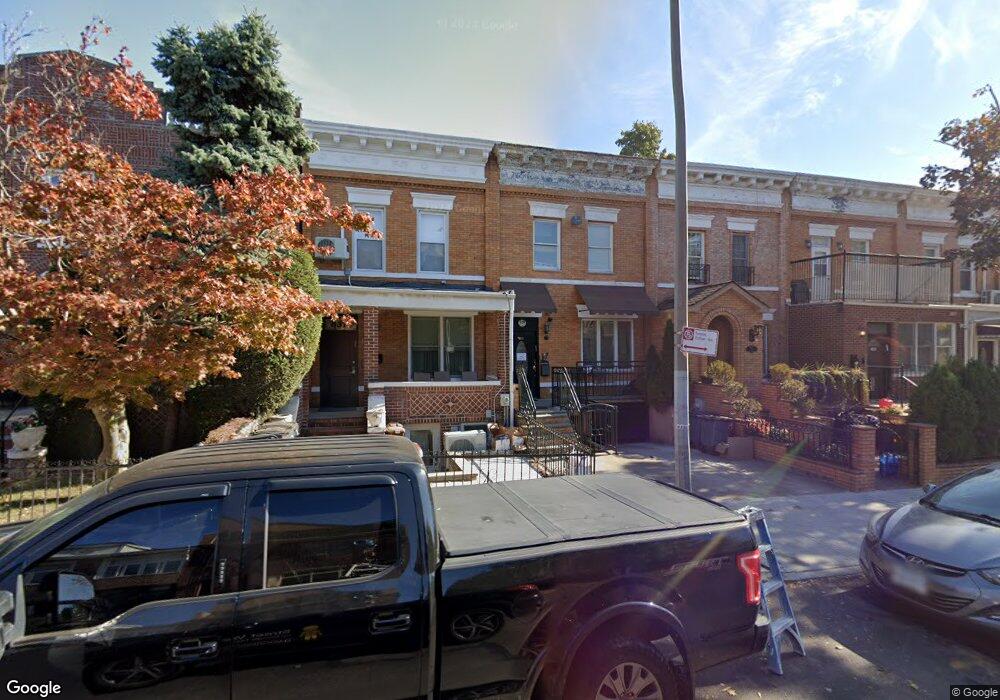
539 E 3rd St Brooklyn, NY 11218
Kensington NeighborhoodEstimated Value: $1,213,000 - $1,316,000
Studio
--
Bath
1,188
Sq Ft
$1,057/Sq Ft
Est. Value
About This Home
This home is located at 539 E 3rd St, Brooklyn, NY 11218 and is currently estimated at $1,255,976, approximately $1,057 per square foot. 539 E 3rd St is a home located in Kings County with nearby schools including P.S. 179 Kensington, Ditmas Junior High school, and Bnos Jerusalem of Belz.
Ownership History
Date
Name
Owned For
Owner Type
Purchase Details
Closed on
Sep 22, 2016
Sold by
Braver Chaya and Braver Yoel
Bought by
Friedman Aron and Friedman Devorah
Current Estimated Value
Home Financials for this Owner
Home Financials are based on the most recent Mortgage that was taken out on this home.
Original Mortgage
$499,999
Outstanding Balance
$399,198
Interest Rate
3.5%
Mortgage Type
New Conventional
Estimated Equity
$856,778
Purchase Details
Closed on
Feb 6, 2006
Sold by
Cohen Faiga and Cohen Yakov
Bought by
Braver Chaya and Braver Yoel
Home Financials for this Owner
Home Financials are based on the most recent Mortgage that was taken out on this home.
Original Mortgage
$67,250
Interest Rate
6.23%
Purchase Details
Closed on
Dec 20, 2005
Sold by
Minkowsky Allan and Minkowsky Larry
Bought by
Minkowsky Philip and Cohen Yakov
Home Financials for this Owner
Home Financials are based on the most recent Mortgage that was taken out on this home.
Original Mortgage
$67,250
Interest Rate
6.23%
Create a Home Valuation Report for This Property
The Home Valuation Report is an in-depth analysis detailing your home's value as well as a comparison with similar homes in the area
Home Values in the Area
Average Home Value in this Area
Purchase History
| Date | Buyer | Sale Price | Title Company |
|---|---|---|---|
| Friedman Aron | $900,000 | -- | |
| Friedman Aron | $900,000 | -- | |
| Friedman Aron | $900,000 | -- | |
| Braver Chaya | $450,000 | -- | |
| Braver Chaya | $450,000 | -- | |
| Minkowsky Philip | -- | -- | |
| Cohen Faiga | $425,000 | -- | |
| Minkowsky Philip | -- | -- |
Source: Public Records
Mortgage History
| Date | Status | Borrower | Loan Amount |
|---|---|---|---|
| Open | Friedman Aron | $499,999 | |
| Closed | Friedman Aron | $499,999 | |
| Previous Owner | Braver Chaya | $67,250 | |
| Previous Owner | Braver Chaya | $360,000 | |
| Previous Owner | Cohen Faiga | $340,000 | |
| Previous Owner | Minkowsky Philip | $0 |
Source: Public Records
Tax History
| Year | Tax Paid | Tax Assessment Tax Assessment Total Assessment is a certain percentage of the fair market value that is determined by local assessors to be the total taxable value of land and additions on the property. | Land | Improvement |
|---|---|---|---|---|
| 2025 | $5,933 | $66,840 | $16,920 | $49,920 |
| 2024 | $5,933 | $62,460 | $16,920 | $45,540 |
| 2023 | $5,660 | $67,560 | $16,920 | $50,640 |
| 2022 | $5,563 | $58,860 | $16,920 | $41,940 |
| 2021 | $5,821 | $59,760 | $16,920 | $42,840 |
| 2020 | $2,730 | $53,220 | $16,920 | $36,300 |
| 2019 | $5,149 | $48,000 | $16,920 | $31,080 |
| 2018 | $4,734 | $23,223 | $8,374 | $14,849 |
| 2017 | $4,734 | $23,223 | $9,688 | $13,535 |
| 2016 | $4,608 | $23,048 | $10,517 | $12,531 |
| 2015 | $2,642 | $21,744 | $12,285 | $9,459 |
| 2014 | $2,642 | $20,514 | $13,898 | $6,616 |
Source: Public Records
Map
Nearby Homes
- 370 Ocean Pkwy Unit 12E
- 370 Ocean Pkwy Unit 8H
- 409 Ave C Unit 3-B
- 415 Ave C Unit 2D
- 360 Ocean Pkwy Unit 5G
- 634 E 3rd St
- 399 Ocean Pkwy Unit 6K
- 399 Ocean Pkwy Unit 5c
- 415 Ocean Pkwy Unit 4B
- 415 Ocean Pkwy Unit 3G
- 415 Ocean Pkwy Unit 3H
- 415 Ocean Pkwy Unit 1J
- 379 Ocean Pkwy Unit PHB
- 379 Ocean Pkwy Unit 3 D
- 379 Ocean Pkwy Unit 2C
- 379 Ocean Pkwy Unit 5C
- 379 Ocean Pkwy Unit 2 B
- 379 Ocean Pkwy Unit 6 A
- 379 Ocean Pkwy Unit 3 B
- 435 Ocean Pkwy Unit 3K
Your Personal Tour Guide
Ask me questions while you tour the home.