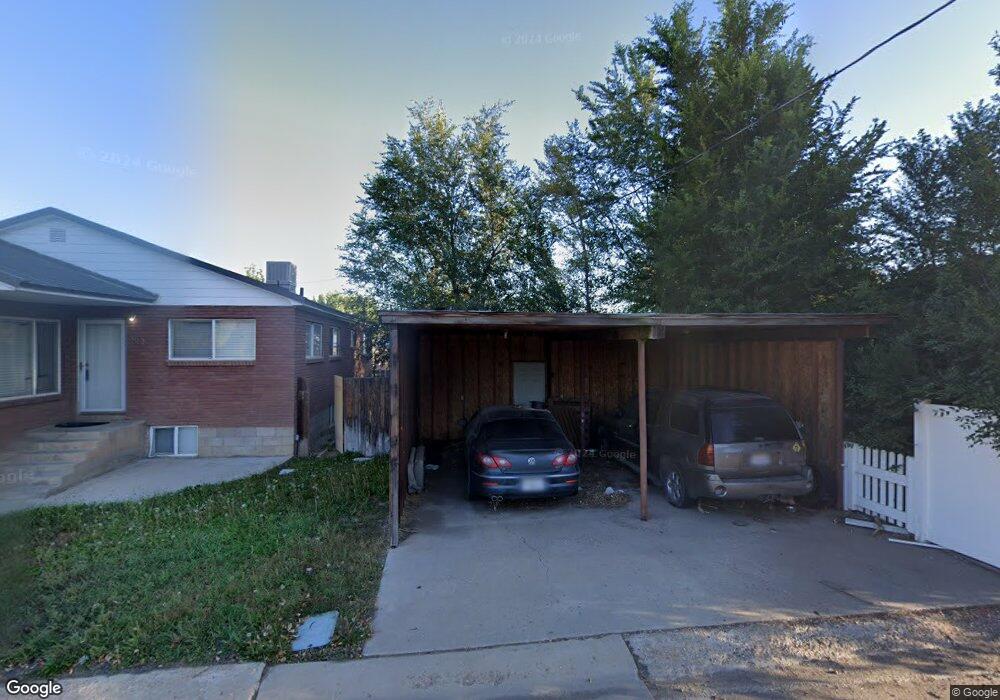
539 E Harmston Ave Roosevelt, UT 84066
Estimated Value: $260,964 - $307,000
4
Beds
3
Baths
2,760
Sq Ft
$103/Sq Ft
Est. Value
About This Home
This home is located at 539 E Harmston Ave, Roosevelt, UT 84066 and is currently estimated at $283,982, approximately $102 per square foot. 539 E Harmston Ave is a home located in Duchesne County with nearby schools including Centennial School, Roosevelt Junior High School, and Union High School.
Ownership History
Date
Name
Owned For
Owner Type
Purchase Details
Closed on
Jul 10, 2025
Sold by
Jensen Shelly B
Bought by
Champa Llc
Current Estimated Value
Home Financials for this Owner
Home Financials are based on the most recent Mortgage that was taken out on this home.
Original Mortgage
$117,500
Outstanding Balance
$117,201
Interest Rate
6.85%
Mortgage Type
Construction
Estimated Equity
$166,781
Purchase Details
Closed on
Oct 7, 2022
Sold by
Frontier Recovery Systems Inc
Bought by
Jensen Shelly B
Create a Home Valuation Report for This Property
The Home Valuation Report is an in-depth analysis detailing your home's value as well as a comparison with similar homes in the area
Home Values in the Area
Average Home Value in this Area
Purchase History
| Date | Buyer | Sale Price | Title Company |
|---|---|---|---|
| Champa Llc | $146,875 | Sunrise Title Co -Roosevelt | |
| Jensen Shelly B | -- | Sunrise Title Inc |
Source: Public Records
Mortgage History
| Date | Status | Borrower | Loan Amount |
|---|---|---|---|
| Open | Champa Llc | $117,500 |
Source: Public Records
Tax History
| Year | Tax Paid | Tax Assessment Tax Assessment Total Assessment is a certain percentage of the fair market value that is determined by local assessors to be the total taxable value of land and additions on the property. | Land | Improvement |
|---|---|---|---|---|
| 2025 | $157 | $12,806 | $12,806 | -- |
| 2024 | $156 | $12,806 | $12,806 | -- |
| 2023 | $156 | $26,249 | $19,296 | $6,953 |
| 2022 | $354 | $25,330 | $18,377 | $6,953 |
| 2021 | $403 | $25,330 | $18,377 | $6,953 |
| 2020 | $397 | $25,330 | $18,377 | $6,953 |
| 2019 | $397 | $25,330 | $18,377 | $6,953 |
| 2018 | $382 | $23,725 | $18,377 | $5,348 |
| 2017 | $362 | $0 | $0 | $0 |
| 2016 | $355 | $0 | $0 | $0 |
| 2015 | $348 | $0 | $0 | $0 |
| 2014 | $340 | $24,527 | $18,377 | $6,150 |
| 2013 | $7 | $510 | $510 | $0 |
Source: Public Records
Map
Nearby Homes
Your Personal Tour Guide
Ask me questions while you tour the home.