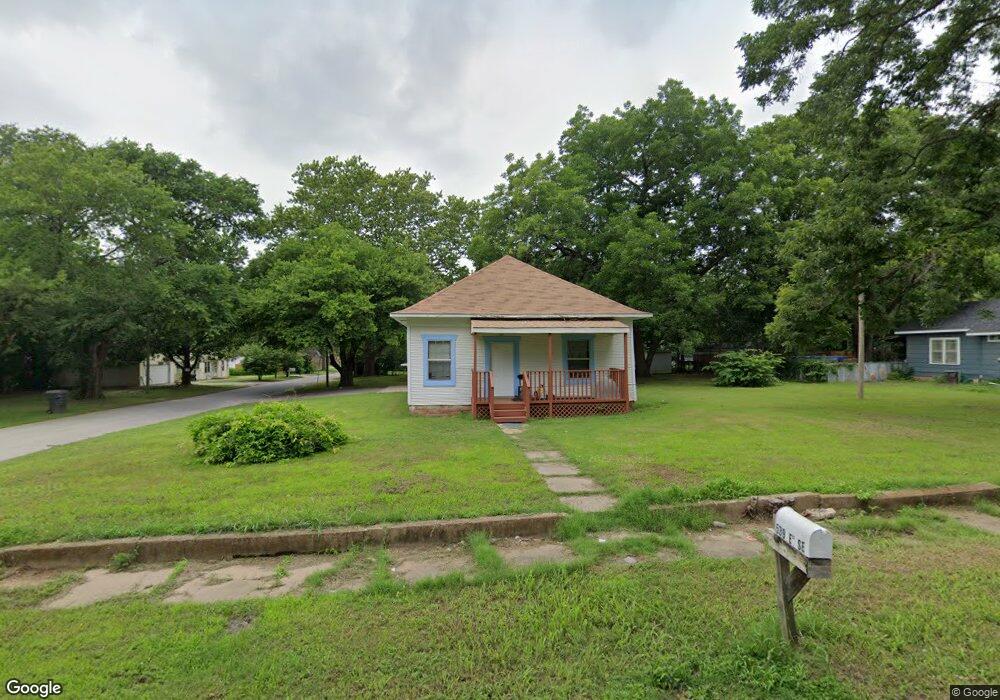
539 E St SE Ardmore, OK 73401
Estimated Value: $72,000 - $97,000
3
Beds
1
Bath
1,120
Sq Ft
$76/Sq Ft
Est. Value
About This Home
This home is located at 539 E St SE, Ardmore, OK 73401 and is currently estimated at $85,613, approximately $76 per square foot. 539 E St SE is a home located in Carter County with nearby schools including Jefferson Elementary School, Ardmore Middle School, and Ardmore High School.
Ownership History
Date
Name
Owned For
Owner Type
Purchase Details
Closed on
Dec 5, 2025
Sold by
Oklahoma Quality Rental Properties Llc
Bought by
Oklahoma Quality Rental Properties Llc
Current Estimated Value
Purchase Details
Closed on
Jun 7, 2024
Sold by
Adler Ash Nadejda
Bought by
Ok Quality Rental Prop Llc
Purchase Details
Closed on
Jun 6, 2022
Sold by
Adler Ash Nadejda
Bought by
Hospitality Industries Llc
Purchase Details
Closed on
Mar 10, 2020
Sold by
Wopila Tanka Llc
Bought by
Dallas Re Holdings Llc
Purchase Details
Closed on
Jul 23, 1998
Sold by
Camp William A
Bought by
Spradling Spradling M and Spradling D
Create a Home Valuation Report for This Property
The Home Valuation Report is an in-depth analysis detailing your home's value as well as a comparison with similar homes in the area
Purchase History
| Date | Buyer | Sale Price | Title Company |
|---|---|---|---|
| Oklahoma Quality Rental Properties Llc | -- | None Listed On Document | |
| Ok Quality Rental Prop Llc | -- | None Listed On Document | |
| Hospitality Industries Llc | -- | Stewart Title | |
| Dallas Re Holdings Llc | $50,000 | Chicago Title Oklahoma | |
| Spradling Spradling M | $21,000 | -- |
Source: Public Records
Tax History
| Year | Tax Paid | Tax Assessment Tax Assessment Total Assessment is a certain percentage of the fair market value that is determined by local assessors to be the total taxable value of land and additions on the property. | Land | Improvement |
|---|---|---|---|---|
| 2025 | $692 | $6,936 | $900 | $6,036 |
| 2024 | $652 | $6,606 | $900 | $5,706 |
| 2023 | $621 | $6,291 | $900 | $5,391 |
| 2022 | $573 | $5,992 | $900 | $5,092 |
| 2021 | $605 | $6,000 | $480 | $5,520 |
| 2020 | $94 | $943 | $480 | $463 |
| 2019 | $87 | $898 | $480 | $418 |
| 2018 | $84 | $855 | $480 | $375 |
| 2017 | $75 | $815 | $480 | $335 |
| 2016 | $72 | $776 | $480 | $296 |
| 2015 | $59 | $767 | $471 | $296 |
| 2014 | $59 | $771 | $471 | $300 |
Source: Public Records
Map
Nearby Homes
Your Personal Tour Guide
Ask me questions while you tour the home.