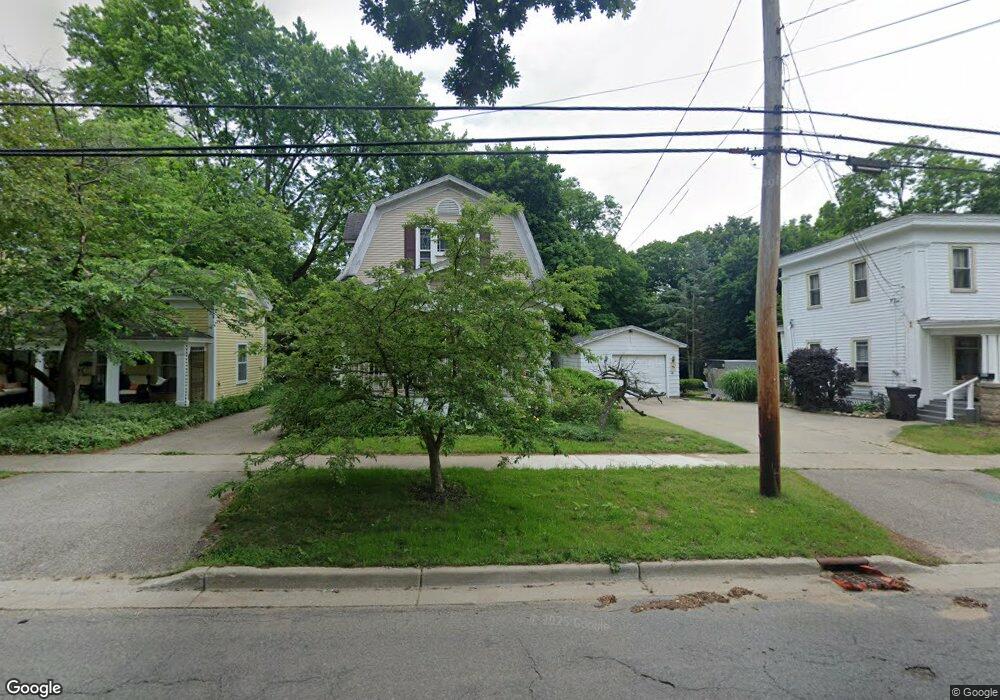
539 Ely St Allegan, MI 49010
Estimated Value: $186,000 - $223,000
3
Beds
1
Bath
1,075
Sq Ft
$189/Sq Ft
Est. Value
About This Home
This home is located at 539 Ely St, Allegan, MI 49010 and is currently estimated at $203,491, approximately $189 per square foot. 539 Ely St is a home located in Allegan County with nearby schools including West Ward Elementary School, L.E. White Middle School, and Allegan High School.
Ownership History
Date
Name
Owned For
Owner Type
Purchase Details
Closed on
Jul 17, 2001
Sold by
Chapman Eric and Chapman Jodi
Bought by
Spreitzer Patrick T and Spreitzer Jaime L
Current Estimated Value
Home Financials for this Owner
Home Financials are based on the most recent Mortgage that was taken out on this home.
Original Mortgage
$71,100
Outstanding Balance
$27,420
Interest Rate
7.15%
Estimated Equity
$176,071
Purchase Details
Closed on
Jan 1, 1987
Create a Home Valuation Report for This Property
The Home Valuation Report is an in-depth analysis detailing your home's value as well as a comparison with similar homes in the area
Home Values in the Area
Average Home Value in this Area
Purchase History
| Date | Buyer | Sale Price | Title Company |
|---|---|---|---|
| Spreitzer Patrick T | $79,000 | Chicago Title Of Michigan In | |
| -- | $35,300 | -- |
Source: Public Records
Mortgage History
| Date | Status | Borrower | Loan Amount |
|---|---|---|---|
| Open | Spreitzer Patrick T | $71,100 |
Source: Public Records
Tax History
| Year | Tax Paid | Tax Assessment Tax Assessment Total Assessment is a certain percentage of the fair market value that is determined by local assessors to be the total taxable value of land and additions on the property. | Land | Improvement |
|---|---|---|---|---|
| 2025 | $1,475 | $93,900 | $19,400 | $74,500 |
| 2024 | $1,342 | $82,200 | $16,900 | $65,300 |
| 2023 | $1,391 | $72,200 | $16,000 | $56,200 |
| 2022 | $1,342 | $63,700 | $13,300 | $50,400 |
| 2021 | $1,283 | $60,100 | $10,500 | $49,600 |
| 2020 | $1,265 | $47,100 | $9,700 | $37,400 |
| 2019 | $1,233 | $36,500 | $8,900 | $27,600 |
| 2018 | $1,185 | $33,200 | $8,700 | $24,500 |
| 2017 | $0 | $31,000 | $7,200 | $23,800 |
| 2016 | $0 | $26,400 | $6,000 | $20,400 |
| 2015 | -- | $26,400 | $6,000 | $20,400 |
| 2014 | -- | $28,000 | $6,000 | $22,000 |
| 2013 | $1,756 | $30,200 | $6,000 | $24,200 |
Source: Public Records
Map
Nearby Homes
Your Personal Tour Guide
Ask me questions while you tour the home.