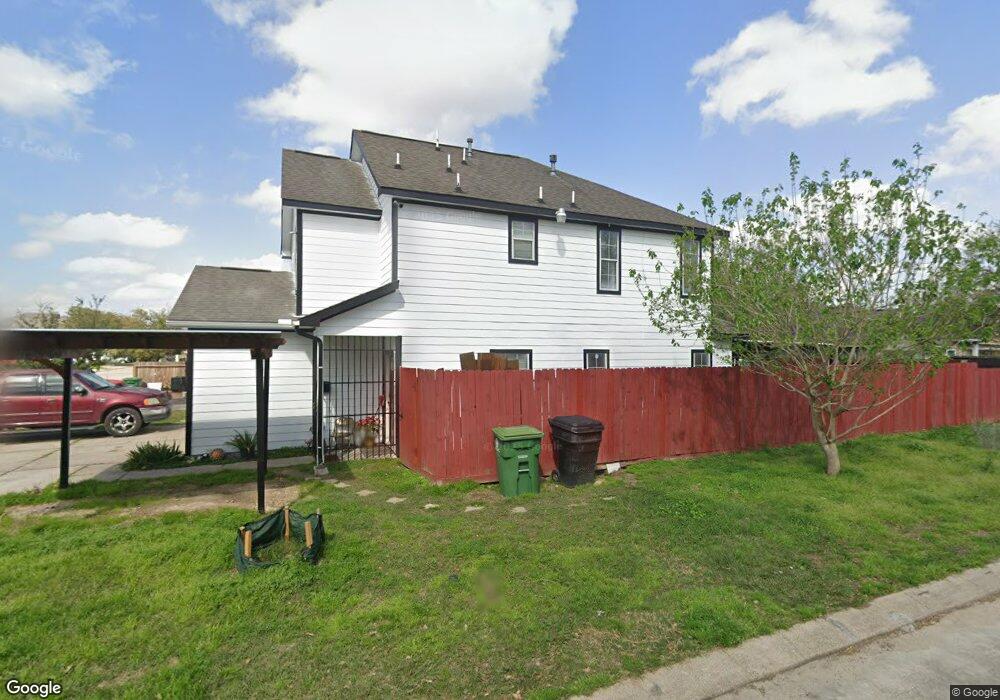
539 Firnat St Houston, TX 77022
Northside-Northline NeighborhoodEstimated Value: $274,257 - $313,000
4
Beds
3
Baths
1,537
Sq Ft
$193/Sq Ft
Est. Value
About This Home
This home is located at 539 Firnat St, Houston, TX 77022 and is currently estimated at $297,064, approximately $193 per square foot. 539 Firnat St is a home located in Harris County with nearby schools including Burbank Elementary School, Burbank Middle School, and Sam Houston Math, Science & Technology Center.
Ownership History
Date
Name
Owned For
Owner Type
Purchase Details
Closed on
Jun 17, 2016
Sold by
Rodriguez Richardo L and Rodriguez Elzabeth R
Bought by
Quistian Jasmin
Current Estimated Value
Home Financials for this Owner
Home Financials are based on the most recent Mortgage that was taken out on this home.
Original Mortgage
$130,000
Outstanding Balance
$103,600
Interest Rate
3.61%
Mortgage Type
New Conventional
Estimated Equity
$193,464
Purchase Details
Closed on
Jun 14, 2005
Sold by
World Building Systems Llc and Garza Kevin H
Bought by
Rodriguez Ricardo L
Home Financials for this Owner
Home Financials are based on the most recent Mortgage that was taken out on this home.
Original Mortgage
$100,800
Interest Rate
5.76%
Mortgage Type
Fannie Mae Freddie Mac
Create a Home Valuation Report for This Property
The Home Valuation Report is an in-depth analysis detailing your home's value as well as a comparison with similar homes in the area
Home Values in the Area
Average Home Value in this Area
Purchase History
| Date | Buyer | Sale Price | Title Company |
|---|---|---|---|
| Quistian Jasmin | -- | None Available | |
| Rodriguez Ricardo L | -- | Fidelity National Title |
Source: Public Records
Mortgage History
| Date | Status | Borrower | Loan Amount |
|---|---|---|---|
| Open | Quistian Jasmin | $130,000 | |
| Previous Owner | Rodriguez Ricardo L | $100,800 | |
| Closed | Rodriguez Ricardo L | $25,200 |
Source: Public Records
Tax History Compared to Growth
Tax History
| Year | Tax Paid | Tax Assessment Tax Assessment Total Assessment is a certain percentage of the fair market value that is determined by local assessors to be the total taxable value of land and additions on the property. | Land | Improvement |
|---|---|---|---|---|
| 2025 | $1,975 | $248,127 | $59,655 | $188,472 |
| 2024 | $1,975 | $266,896 | $59,655 | $207,241 |
| 2023 | $1,975 | $200,548 | $59,655 | $140,893 |
| 2022 | $3,086 | $160,046 | $42,753 | $117,293 |
| 2021 | $2,969 | $127,396 | $23,862 | $103,534 |
| 2020 | $2,954 | $122,000 | $23,862 | $98,138 |
| 2019 | $3,635 | $143,643 | $23,862 | $119,781 |
| 2018 | $2,775 | $151,212 | $23,862 | $127,350 |
| 2017 | $3,823 | $151,212 | $23,862 | $127,350 |
| 2016 | $2,680 | $106,000 | $23,862 | $82,138 |
| 2015 | -- | $106,000 | $23,862 | $82,138 |
| 2014 | -- | $128,987 | $23,862 | $105,125 |
Source: Public Records
Map
Nearby Homes
- 9026 Mcgallion Rd
- 807 Firnat St
- 702 Pennington St
- 723 Doverside St
- 318 Charlock St
- 1207 Firnat St
- 88 Berry Rd
- 253 De Boll St
- 249 De Boll St
- 411 Berry Rd
- 216 Burress St
- 8411 Berry Brush Ln
- 8402 Berry Green Ln
- 802 Berry Sage Ln
- 8205 Appleton St
- 132 Grothe Ln
- 108 Fichter St
- 415 Briarcliff Dr
- 1104 Charnwood St
- 202 Burbank St