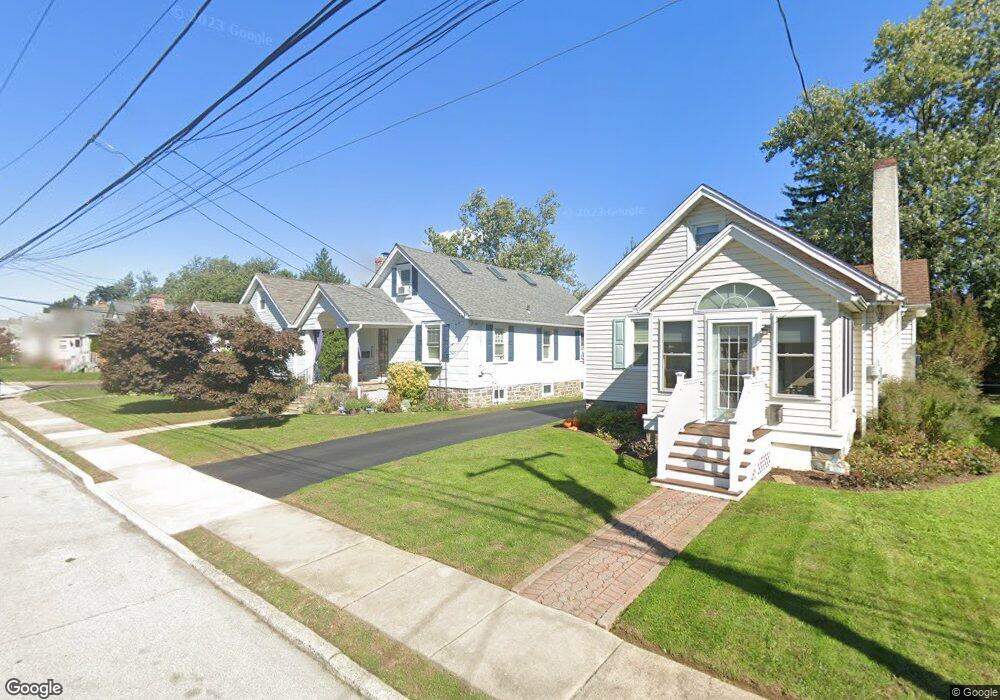
539 Furlong Ave Havertown, PA 19083
Estimated Value: $367,000 - $408,000
2
Beds
1
Bath
1,149
Sq Ft
$338/Sq Ft
Est. Value
About This Home
This home is located at 539 Furlong Ave, Havertown, PA 19083 and is currently estimated at $388,617, approximately $338 per square foot. 539 Furlong Ave is a home located in Delaware County with nearby schools including Manoa Elementary School, Haverford Middle School, and Haverford Senior High School.
Ownership History
Date
Name
Owned For
Owner Type
Purchase Details
Closed on
Oct 4, 2015
Sold by
Lloyd Jacqueline K
Bought by
Lloyd Scott
Current Estimated Value
Home Financials for this Owner
Home Financials are based on the most recent Mortgage that was taken out on this home.
Original Mortgage
$120,000
Outstanding Balance
$94,415
Interest Rate
3.88%
Mortgage Type
New Conventional
Estimated Equity
$294,202
Purchase Details
Closed on
May 1, 2002
Sold by
Friedl Gerhard
Bought by
Lloyd Jacqueline K
Home Financials for this Owner
Home Financials are based on the most recent Mortgage that was taken out on this home.
Original Mortgage
$111,200
Interest Rate
7.18%
Purchase Details
Closed on
Jul 11, 1997
Sold by
Friedl Gerhard and Friedl Irmgard M
Bought by
Friedl Gerhard
Create a Home Valuation Report for This Property
The Home Valuation Report is an in-depth analysis detailing your home's value as well as a comparison with similar homes in the area
Home Values in the Area
Average Home Value in this Area
Purchase History
| Date | Buyer | Sale Price | Title Company |
|---|---|---|---|
| Lloyd Scott | $150,000 | None Available | |
| Lloyd Jacqueline K | $139,000 | Commonwealth Land Title Ins | |
| Friedl Gerhard | -- | -- |
Source: Public Records
Mortgage History
| Date | Status | Borrower | Loan Amount |
|---|---|---|---|
| Open | Lloyd Scott | $120,000 | |
| Previous Owner | Lloyd Jacqueline K | $111,200 |
Source: Public Records
Tax History Compared to Growth
Tax History
| Year | Tax Paid | Tax Assessment Tax Assessment Total Assessment is a certain percentage of the fair market value that is determined by local assessors to be the total taxable value of land and additions on the property. | Land | Improvement |
|---|---|---|---|---|
| 2025 | $5,395 | $209,820 | $87,160 | $122,660 |
| 2024 | $5,395 | $209,820 | $87,160 | $122,660 |
| 2023 | $5,242 | $209,820 | $87,160 | $122,660 |
| 2022 | $5,119 | $209,820 | $87,160 | $122,660 |
| 2021 | $7,871 | $209,820 | $87,160 | $122,660 |
| 2020 | $1,281 | $111,480 | $50,040 | $61,440 |
| 2019 | $1,252 | $111,480 | $50,040 | $61,440 |
| 2018 | $1,220 | $111,480 | $0 | $0 |
| 2017 | $1,246 | $111,480 | $0 | $0 |
| 2016 | $612 | $111,480 | $0 | $0 |
| 2015 | $612 | $111,480 | $0 | $0 |
| 2014 | $612 | $111,480 | $0 | $0 |
Source: Public Records
Map
Nearby Homes
- 206 Stanley Ave
- 213 N Ormond Ave
- 636 S Eagle Rd
- 162 S Eagle Rd
- 555 Grand Ave
- 635 Grand Ave
- 155 Wyndmoor Rd
- 1950 W Chester Pike
- 12 Claremont Blvd
- 1232 Steel Rd
- 14 Claremont Blvd
- 119 Wilson Ave
- 10 Claremont Blvd
- 220 Glendale Rd
- 6 N Lexington Ave
- 32 Westwood Park Dr
- 112 Walnut Hill Ln
- 145 Sycamore Rd
- 1217 Ormond Ave
- 542 Wales Rd
- 537 Furlong Ave
- 541 Furlong Ave
- 535 Furlong Ave
- 601 Furlong Ave
- 533 Furlong Ave
- 603 Furlong Ave
- 536 Furlong Ave
- 531 Furlong Ave
- 534 Furlong Ave
- 538 Furlong Ave
- 532 Furlong Ave
- 530 Furlong Ave
- 600 Furlong Ave
- 529 Furlong Ave
- 602 Furlong Ave
- 607 Furlong Ave
- 528 Furlong Ave
- 1007 Bon Air Rd
- 604 Furlong Ave
- 527 Furlong Ave