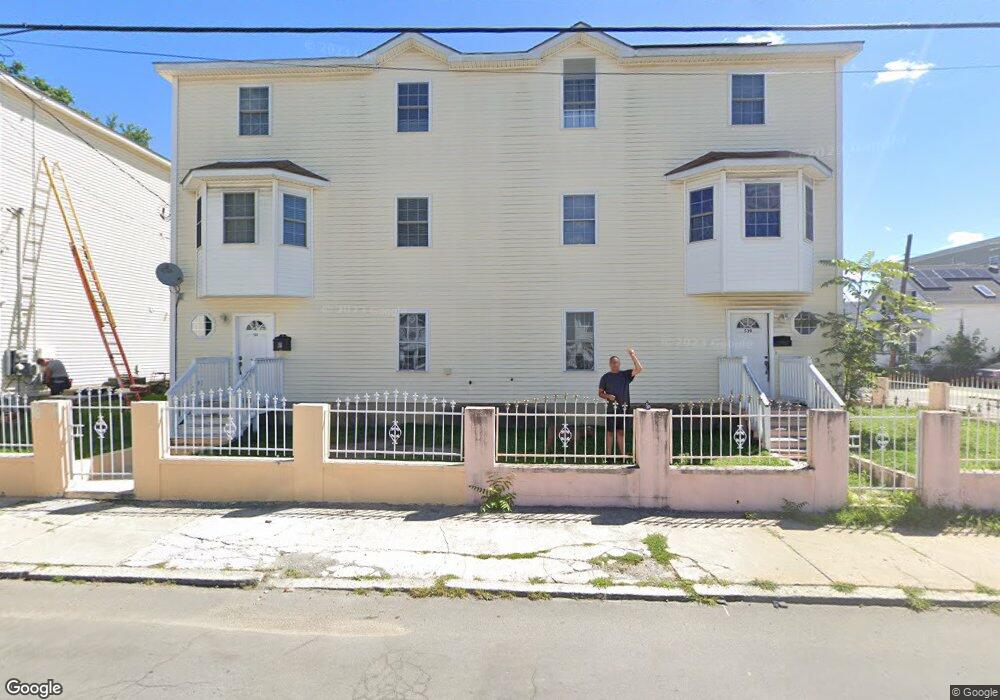
539 Hampshire St Lawrence, MA 01841
Arlington NeighborhoodEstimated Value: $500,000 - $650,000
3
Beds
4
Baths
1,800
Sq Ft
$318/Sq Ft
Est. Value
About This Home
This home is located at 539 Hampshire St, Lawrence, MA 01841 and is currently estimated at $571,542, approximately $317 per square foot. 539 Hampshire St is a home located in Essex County with nearby schools including John Hopkins Elementary School, Olive Branch Elementary School, and Arlington Elementary School.
Ownership History
Date
Name
Owned For
Owner Type
Purchase Details
Closed on
May 9, 2008
Sold by
Garcia Family Llc
Bought by
Perez Virginia L
Current Estimated Value
Home Financials for this Owner
Home Financials are based on the most recent Mortgage that was taken out on this home.
Original Mortgage
$184,920
Outstanding Balance
$117,415
Interest Rate
5.93%
Mortgage Type
Purchase Money Mortgage
Estimated Equity
$454,127
Purchase Details
Closed on
Jan 24, 2006
Sold by
Deutsche Bk Natl T C
Bought by
Sosa Adriano and Garcia Eugenio
Home Financials for this Owner
Home Financials are based on the most recent Mortgage that was taken out on this home.
Original Mortgage
$55,555
Interest Rate
6.33%
Mortgage Type
Purchase Money Mortgage
Purchase Details
Closed on
Mar 8, 2004
Sold by
Neves Lino and Neves Maria
Bought by
Neves Lino
Purchase Details
Closed on
Jan 2, 1990
Sold by
Rippe George
Bought by
King Timothy
Create a Home Valuation Report for This Property
The Home Valuation Report is an in-depth analysis detailing your home's value as well as a comparison with similar homes in the area
Home Values in the Area
Average Home Value in this Area
Purchase History
| Date | Buyer | Sale Price | Title Company |
|---|---|---|---|
| Perez Virginia L | $201,000 | -- | |
| Sosa Adriano | $290,000 | -- | |
| Neves Lino | -- | -- | |
| King Timothy | $520,000 | -- |
Source: Public Records
Mortgage History
| Date | Status | Borrower | Loan Amount |
|---|---|---|---|
| Open | Perez Virginia L | $184,920 | |
| Previous Owner | Sosa Adriano | $55,555 | |
| Previous Owner | King Timothy | $22,519 | |
| Previous Owner | King Timothy | $27,642 | |
| Previous Owner | King Timothy | $202,000 |
Source: Public Records
Tax History Compared to Growth
Tax History
| Year | Tax Paid | Tax Assessment Tax Assessment Total Assessment is a certain percentage of the fair market value that is determined by local assessors to be the total taxable value of land and additions on the property. | Land | Improvement |
|---|---|---|---|---|
| 2025 | $3,529 | $401,000 | $0 | $401,000 |
| 2024 | $3,332 | $360,200 | $0 | $360,200 |
| 2023 | $3,255 | $320,400 | $0 | $320,400 |
| 2022 | $3,402 | $297,400 | $0 | $297,400 |
| 2021 | $3,247 | $264,600 | $0 | $264,600 |
| 2020 | $2,950 | $237,300 | $0 | $237,300 |
| 2019 | $2,565 | $187,500 | $0 | $187,500 |
| 2018 | $1,983 | $138,500 | $0 | $138,500 |
| 2017 | $1,927 | $125,600 | $0 | $125,600 |
| 2016 | $1,900 | $122,500 | $0 | $122,500 |
| 2015 | $1,852 | $122,500 | $0 | $122,500 |
Source: Public Records
Map
Nearby Homes
- 5 Arlington Terrace
- 364 Lawrence St
- 2 Lawrence St
- 83 Oakside Ave
- 82 Oakside Ave
- 87 Oakside Ave
- 18 Larchwood Rd
- 434-438 Hampshire St
- 48 Larchwood Rd
- 129-131 Lexington St
- 169 Berkeley St
- 183 Berkeley St
- 27 Exchange St
- 100-102 Phillips St
- 29 Willow St Unit B
- 24 Bennington St
- 69 Broadway
- 32 Alma St Unit 32
- 7 Magnolia Rd
- 35 Hardy St
- 545 Hampshire St Unit 1
- 545 Hampshire St
- 543 Hampshire St
- 545 Hampshire St Unit 545
- 541 Hampshire St
- 25 Center St
- 336 Walnut St Unit 1
- 334 Walnut St
- 548 Hampshire St Unit 550
- 544 Hampshire St Unit 546
- 552 Hampshire St
- 338 Walnut St
- 338 Walnut St Unit 2
- 561 Hampshire St
- 544-546 Hampshire St
- 558 Hampshire St
- 340 Lawrence St
- 342-344 Lawrence St
- 342 Lawrence St Unit 344
- 540 Hampshire St Unit 542