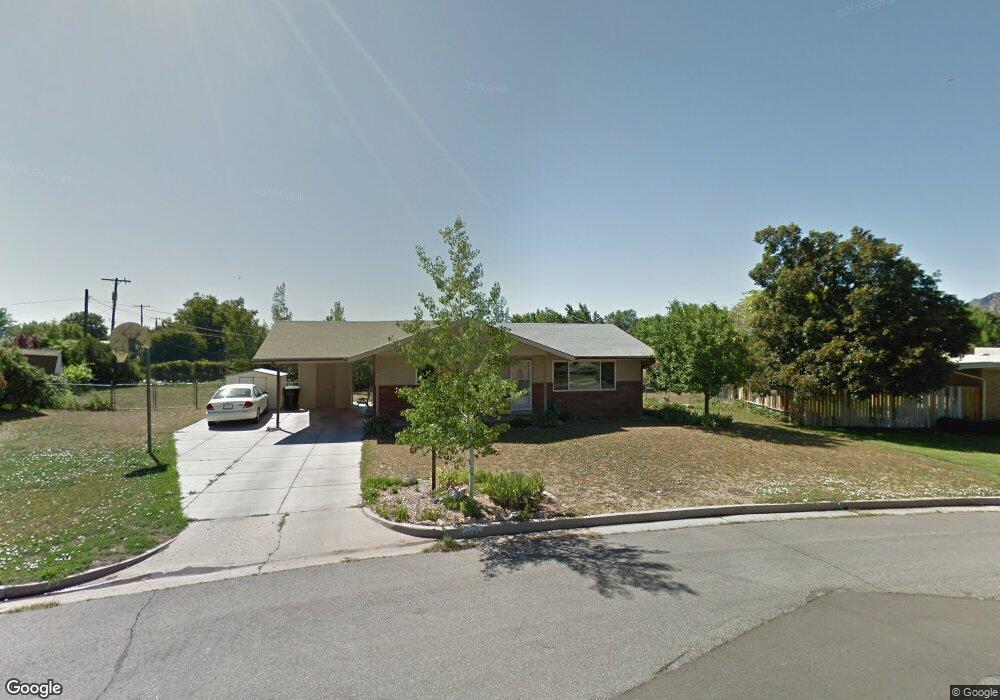
539 Hawthorne St Brigham City, UT 84302
Estimated Value: $345,000 - $400,000
3
Beds
2
Baths
1,950
Sq Ft
$196/Sq Ft
Est. Value
About This Home
This home is located at 539 Hawthorne St, Brigham City, UT 84302 and is currently estimated at $383,110, approximately $196 per square foot. 539 Hawthorne St is a home located in Box Elder County with nearby schools including Golden Spike Elementary, Box Elder Middle School, and Adele C. Young Intermediate School.
Ownership History
Date
Name
Owned For
Owner Type
Purchase Details
Closed on
Jun 11, 2015
Sold by
Bassett Deanna L
Bought by
Peck David D and Peck Kathryn C
Current Estimated Value
Home Financials for this Owner
Home Financials are based on the most recent Mortgage that was taken out on this home.
Original Mortgage
$146,585
Outstanding Balance
$113,086
Interest Rate
3.64%
Mortgage Type
VA
Estimated Equity
$270,024
Purchase Details
Closed on
Feb 22, 2008
Sold by
Henstra Deanna Nelson
Bought by
Henstra Deanna L
Home Financials for this Owner
Home Financials are based on the most recent Mortgage that was taken out on this home.
Original Mortgage
$102,600
Interest Rate
5.64%
Mortgage Type
New Conventional
Purchase Details
Closed on
Dec 7, 2007
Sold by
Henstra Travis C
Bought by
Henstra Deanna Nelson
Create a Home Valuation Report for This Property
The Home Valuation Report is an in-depth analysis detailing your home's value as well as a comparison with similar homes in the area
Home Values in the Area
Average Home Value in this Area
Purchase History
| Date | Buyer | Sale Price | Title Company |
|---|---|---|---|
| Peck David D | -- | American Secure Title Logan | |
| Henstra Deanna L | -- | -- | |
| Henstra Deanna Nelson | -- | -- |
Source: Public Records
Mortgage History
| Date | Status | Borrower | Loan Amount |
|---|---|---|---|
| Open | Peck David D | $146,585 | |
| Previous Owner | Henstra Deanna L | $102,600 |
Source: Public Records
Tax History Compared to Growth
Tax History
| Year | Tax Paid | Tax Assessment Tax Assessment Total Assessment is a certain percentage of the fair market value that is determined by local assessors to be the total taxable value of land and additions on the property. | Land | Improvement |
|---|---|---|---|---|
| 2025 | $1,729 | $339,923 | $105,000 | $234,923 |
| 2024 | $1,729 | $332,872 | $100,000 | $232,872 |
| 2023 | $1,725 | $340,100 | $95,000 | $245,100 |
| 2022 | $1,780 | $179,422 | $22,000 | $157,422 |
| 2021 | $1,302 | $199,046 | $40,000 | $159,046 |
| 2020 | $1,225 | $199,046 | $40,000 | $159,046 |
| 2019 | $1,150 | $99,412 | $22,000 | $77,412 |
| 2018 | $1,039 | $89,315 | $22,000 | $67,315 |
| 2017 | $942 | $140,251 | $16,500 | $110,251 |
| 2016 | $987 | $74,251 | $16,500 | $57,751 |
| 2015 | $918 | $69,001 | $16,500 | $52,501 |
| 2014 | $918 | $66,501 | $16,500 | $50,001 |
| 2013 | -- | $66,501 | $16,500 | $50,001 |
Source: Public Records
Map
Nearby Homes