
Seller's Agent in 2025
Lois Blank
Assured Real Estate
(440) 265-0820
7 in this area
100 Total Sales

Estimated Value: $244,000 - $332,000
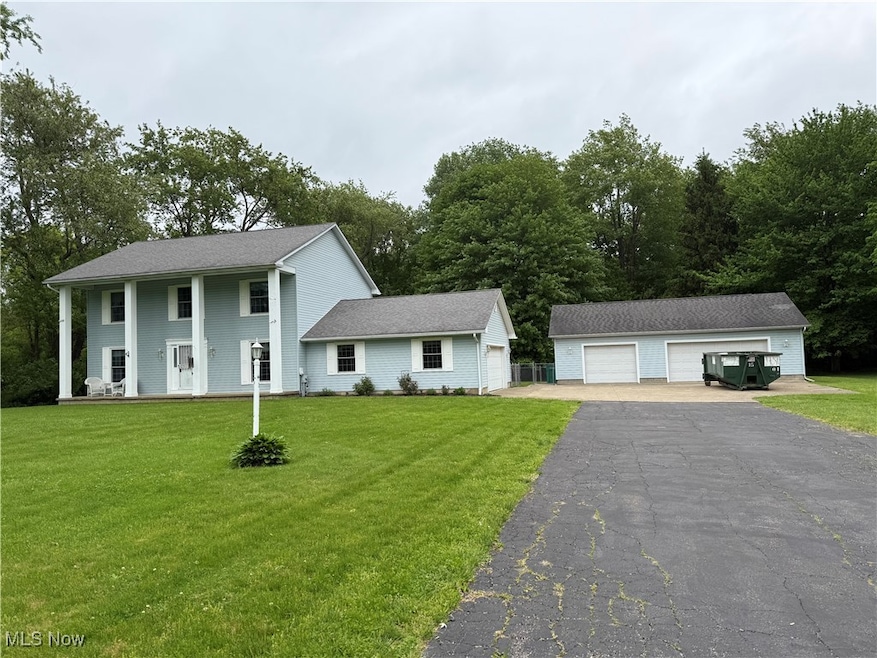
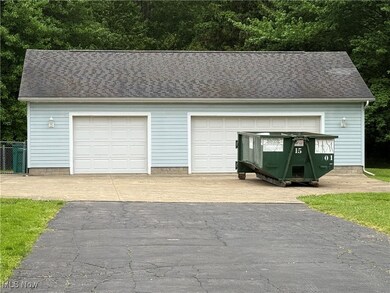
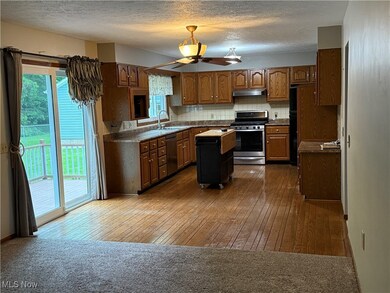
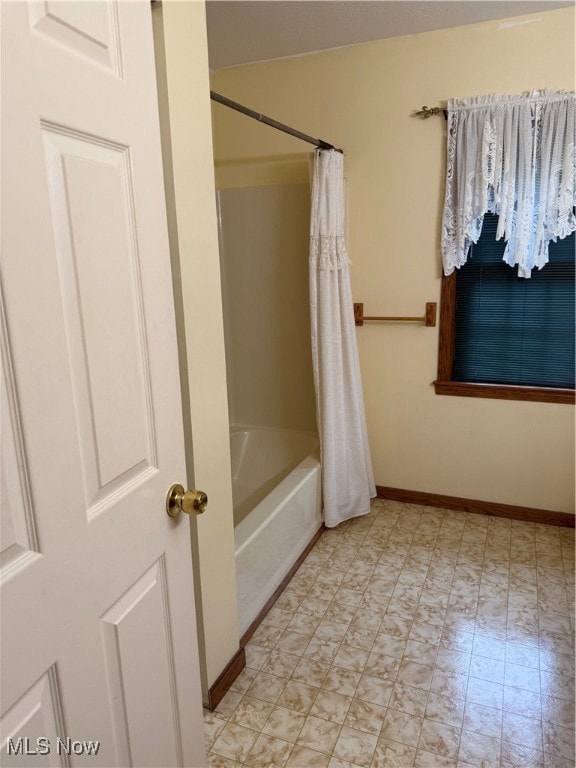
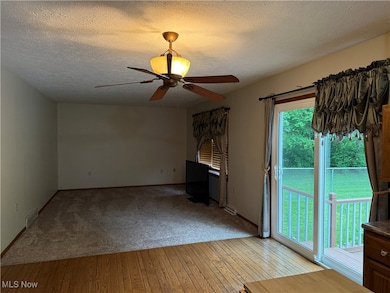
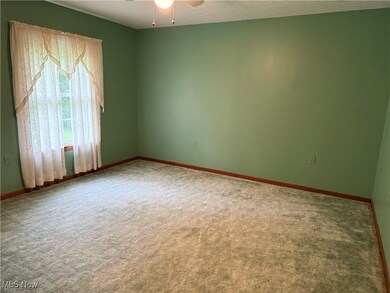
Welcome to your dream home with so many wonderful features. It includes a large eat-in kitchen with oak cabinets and plenty of working counter space. Enjoy the fridge, stove and dishwasher. There is double doors out to a large rear deck for entertaining and also a great room attached to the kitchen. This home boasts a large formal dining and living room plus a powder room on the first floor. Upstairs you will find 3 large bedrooms and 2 full bathrooms including the master bedroom and master bath. In the basement is a full custom bar that was moved there from a commercial building and a rec/media room. What a great entertainment area for friends and guests. There is also a laundry/furnace area in the basement. The outside features a fenced in backyard for your children and pets. There is also a 5 car garage. 2 Attached to the house and a 3 car detached. They feature electric plus drains. This is a must see property. Seller installed all new windows with a lifetime warranty, tear off new roof, new vinyl siding, new hot water tank and septic was pumped and checked an the distribution box was replaced. All appliances stay. Don't pass up this beautiful colonial situated in one of the greatest quiet neighborhood. Make your appointment today to view this lovely home.
Last Agent to Sell the Property
Assured Real Estate Brokerage Email: 440-576-7355 info@assuredrealestateoh.com License #246586 Listed on: 05/19/2025
| Date | Buyer | Sale Price | Title Company |
|---|---|---|---|
| Luthringer Tricia L | $305,000 | First Source Title | |
| Luthringer Tricia L | $305,000 | First Source Title | |
| Blades Louis | $175,000 | Midland Title | |
| Cunningham Bart L | $182,000 | -- | |
| Mclaughlin David L | $150,000 | -- |
| Date | Status | Borrower | Loan Amount |
|---|---|---|---|
| Open | Luthringer Tricia L | $220,000 | |
| Closed | Luthringer Tricia L | $220,000 | |
| Previous Owner | Blades Louis | $140,000 | |
| Previous Owner | Cunningham Bart L | $160,000 | |
| Previous Owner | Mclaughlin David L | $120,000 |
| Date | Event | Price | List to Sale | Price per Sq Ft |
|---|---|---|---|---|
| 07/18/2025 07/18/25 | Sold | $315,000 | -3.0% | $102 / Sq Ft |
| 06/14/2025 06/14/25 | Pending | -- | -- | -- |
| 06/09/2025 06/09/25 | Price Changed | $324,900 | -1.5% | $105 / Sq Ft |
| 05/19/2025 05/19/25 | For Sale | $329,900 | -- | $107 / Sq Ft |
| Year | Tax Paid | Tax Assessment Tax Assessment Total Assessment is a certain percentage of the fair market value that is determined by local assessors to be the total taxable value of land and additions on the property. | Land | Improvement |
|---|---|---|---|---|
| 2024 | $5,018 | $68,600 | $11,340 | $57,260 |
| 2023 | $2,760 | $68,600 | $11,340 | $57,260 |
| 2022 | $3,133 | $58,490 | $8,720 | $49,770 |
| 2021 | $3,187 | $58,490 | $8,720 | $49,770 |
| 2020 | $3,185 | $58,490 | $8,720 | $49,770 |
| 2019 | $2,660 | $47,950 | $4,830 | $43,120 |
| 2018 | $2,538 | $47,950 | $4,830 | $43,120 |
| 2017 | $2,534 | $47,950 | $4,830 | $43,120 |
| 2016 | $2,534 | $52,050 | $5,250 | $46,800 |
| 2015 | $2,560 | $52,050 | $5,250 | $46,800 |
| 2014 | $2,265 | $52,050 | $5,250 | $46,800 |
| 2013 | $6,877 | $51,180 | $3,400 | $47,780 |
Seller's Agent in 2025
Lois Blank
Assured Real Estate
(440) 265-0820
7 in this area
100 Total Sales
Buyer's Agent in 2025
Nicole Peterson
McDowell Homes Real Estate Services
(440) 683-6580
1 in this area
290 Total Sales
Source: MLS Now
MLS Number: 5123867
APN: 123500004200
Disclaimer: Certain information contained herein is derived from information provided by parties other than Homes.com. All information provided is deemed reliable, but is not guaranteed to be accurate and should be independently verified.
![]() IDX information is provided exclusively for personal, non-commercial use, and may not be used for any purpose other than to identify prospective properties consumers may be interested in purchasing. Information is deemed reliable but not guaranteed.
IDX information is provided exclusively for personal, non-commercial use, and may not be used for any purpose other than to identify prospective properties consumers may be interested in purchasing. Information is deemed reliable but not guaranteed.
Ask me questions while you tour the home.