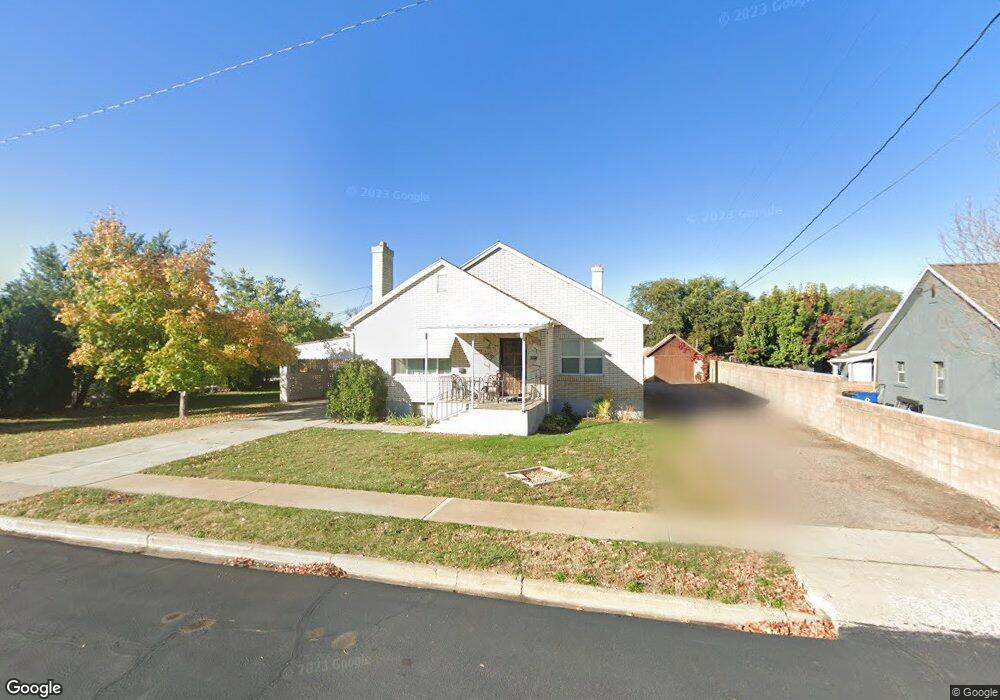
539 N 100 W Spanish Fork, UT 84660
Estimated Value: $427,000 - $600,000
3
Beds
2
Baths
1,977
Sq Ft
$258/Sq Ft
Est. Value
About This Home
This home is located at 539 N 100 W, Spanish Fork, UT 84660 and is currently estimated at $510,617, approximately $258 per square foot. 539 N 100 W is a home located in Utah County with nearby schools including Brockbank Elementary School, Spanish Fork Jr High School, and Spanish Fork High School.
Ownership History
Date
Name
Owned For
Owner Type
Purchase Details
Closed on
Oct 3, 2014
Sold by
Bingham Finch Monroe and Swenson Nancy B
Bought by
Hardman Cynthia
Current Estimated Value
Home Financials for this Owner
Home Financials are based on the most recent Mortgage that was taken out on this home.
Original Mortgage
$173,655
Outstanding Balance
$132,985
Interest Rate
4.07%
Mortgage Type
VA
Estimated Equity
$377,632
Purchase Details
Closed on
Oct 24, 2001
Sold by
Bingham Laura F
Bought by
Bingham Laura F and Bingham Finch Monroe
Purchase Details
Closed on
Apr 20, 1998
Sold by
Rodda Rulon A and Rodda Lorell
Bought by
Bingham Laura
Create a Home Valuation Report for This Property
The Home Valuation Report is an in-depth analysis detailing your home's value as well as a comparison with similar homes in the area
Home Values in the Area
Average Home Value in this Area
Purchase History
| Date | Buyer | Sale Price | Title Company |
|---|---|---|---|
| Hardman Cynthia | -- | North American Title | |
| Bingham Laura F | -- | -- | |
| Bingham Laura | -- | Provo Abstract Company |
Source: Public Records
Mortgage History
| Date | Status | Borrower | Loan Amount |
|---|---|---|---|
| Open | Hardman Cynthia | $173,655 |
Source: Public Records
Tax History Compared to Growth
Tax History
| Year | Tax Paid | Tax Assessment Tax Assessment Total Assessment is a certain percentage of the fair market value that is determined by local assessors to be the total taxable value of land and additions on the property. | Land | Improvement |
|---|---|---|---|---|
| 2025 | $1,967 | $219,340 | $173,600 | $225,200 |
| 2024 | $1,967 | $202,785 | $0 | $0 |
| 2023 | $1,964 | $202,620 | $0 | $0 |
| 2022 | $1,923 | $194,590 | $0 | $0 |
| 2021 | $1,602 | $259,400 | $100,700 | $158,700 |
| 2020 | $1,442 | $226,900 | $83,900 | $143,000 |
| 2019 | $1,313 | $217,500 | $83,900 | $133,600 |
| 2018 | $1,250 | $200,100 | $83,900 | $116,200 |
| 2017 | $1,090 | $115,390 | $0 | $0 |
| 2016 | $1,105 | $93,830 | $0 | $0 |
| 2015 | $1,113 | $93,335 | $0 | $0 |
| 2014 | -- | $85,965 | $0 | $0 |
Source: Public Records
Map
Nearby Homes