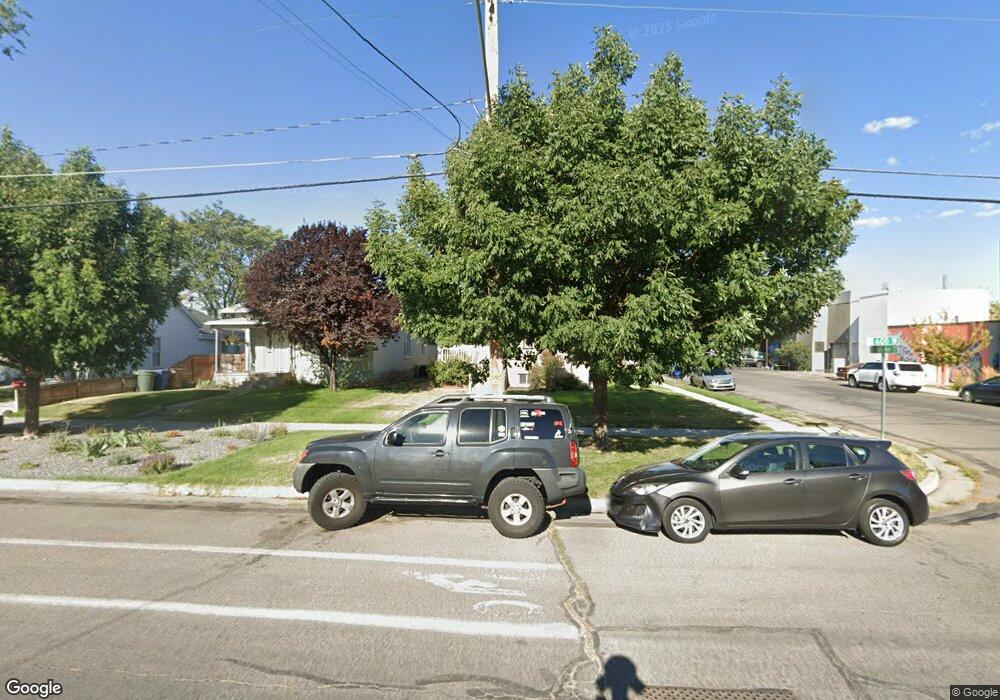
539 N 600 W Salt Lake City, UT 84116
Capitol Hill NeighborhoodEstimated Value: $426,000 - $496,559
3
Beds
3
Baths
2,024
Sq Ft
$230/Sq Ft
Est. Value
About This Home
This home is located at 539 N 600 W, Salt Lake City, UT 84116 and is currently estimated at $465,640, approximately $230 per square foot. 539 N 600 W is a home located in Salt Lake County with nearby schools including Mary W. Jackson Elementary School, West High, and Open Classroom.
Ownership History
Date
Name
Owned For
Owner Type
Purchase Details
Closed on
Mar 27, 2018
Sold by
Fagen Linda M
Bought by
Sabharwal Abhineet
Current Estimated Value
Home Financials for this Owner
Home Financials are based on the most recent Mortgage that was taken out on this home.
Original Mortgage
$233,000
Outstanding Balance
$136,700
Interest Rate
4.38%
Mortgage Type
New Conventional
Estimated Equity
$328,940
Purchase Details
Closed on
Mar 18, 2008
Sold by
Fagen Linda Marie
Bought by
Fagen Linda M and The Linda M Fagen Living Trust
Create a Home Valuation Report for This Property
The Home Valuation Report is an in-depth analysis detailing your home's value as well as a comparison with similar homes in the area
Home Values in the Area
Average Home Value in this Area
Purchase History
| Date | Buyer | Sale Price | Title Company |
|---|---|---|---|
| Sabharwal Abhineet | -- | Meridian Title | |
| Fagen Linda M | -- | None Available |
Source: Public Records
Mortgage History
| Date | Status | Borrower | Loan Amount |
|---|---|---|---|
| Open | Sabharwal Abhineet | $233,000 |
Source: Public Records
Tax History Compared to Growth
Tax History
| Year | Tax Paid | Tax Assessment Tax Assessment Total Assessment is a certain percentage of the fair market value that is determined by local assessors to be the total taxable value of land and additions on the property. | Land | Improvement |
|---|---|---|---|---|
| 2025 | $2,404 | $514,200 | $109,400 | $404,800 |
| 2024 | $2,404 | $458,700 | $103,600 | $355,100 |
| 2023 | $2,329 | $428,300 | $89,600 | $338,700 |
| 2022 | $2,479 | $427,700 | $87,900 | $339,800 |
| 2021 | $2,123 | $331,700 | $69,600 | $262,100 |
| 2020 | $2,035 | $302,600 | $62,200 | $240,400 |
| 2019 | $2,037 | $285,000 | $59,100 | $225,900 |
| 2018 | $2,007 | $273,400 | $59,100 | $214,300 |
| 2017 | $564 | $279,600 | $59,100 | $220,500 |
| 2016 | $595 | $236,400 | $56,800 | $179,600 |
| 2015 | $164 | $206,900 | $55,700 | $151,200 |
| 2014 | $1,612 | $183,700 | $50,600 | $133,100 |
Source: Public Records
Map
Nearby Homes
- 422 N Hodges Ln
- 505 N Bright Ct
- 535 N Grant St
- 767 W 400 N
- 443 W 400 St N Unit 202
- 443 W 400 St N Unit 301
- 443 W 400 St N Unit 201
- 443 W 400 St N Unit 102
- Franklin C Plan at The Iris - theIRIS
- Franklin B Plan at The Iris - theIRIS
- Franklin A Plan at The Iris - theIRIS
- Holzer Plan at Bishop Place
- Saville Plan at Bishop Place
- McEwen Plan at Bishop Place
- Montgomery Plan at Bishop Place
- 447 N Pugsley St
- 577 N 900 W
- 632 W 200 N
- 241 N 800 W
- 716 N 300 W
- 531 N 600 W
- 525 N 600 W
- 521 N 600 W Unit 523
- 602 W Girard Ave N
- 606 W Girard Ave Unit Condo
- 606 W Girard Ave
- 606 W Girard Ave
- 606 W Girard Ave Unit B
- 606 W Girard Ave Unit A
- 606 W Girard Ave Unit D
- 626 W Girard Ave
- 517 N 500 W
- 630 W Girard Ave
- 515 N 600 W
- 517 N 600 W
- 536 N 600 W
- 616 W 500 N
- 540 N 600 W
- 540 N 600 W Unit 2
- 618 W 500 N