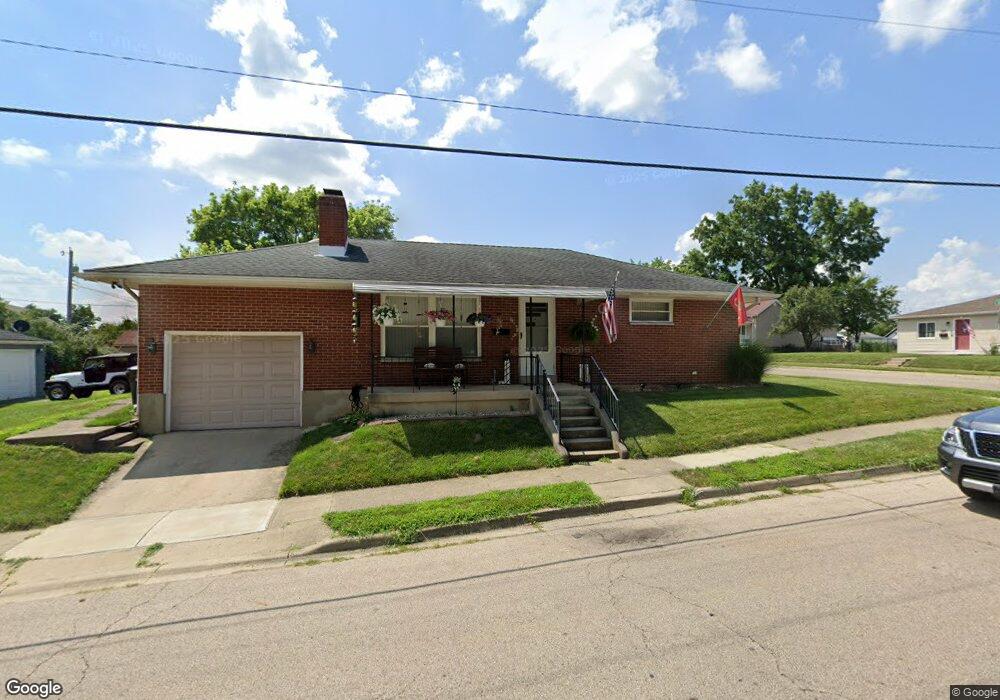
539 N 9th St Miamisburg, OH 45342
Downtown Miamisburg NeighborhoodEstimated Value: $139,000 - $150,898
2
Beds
1
Bath
900
Sq Ft
$160/Sq Ft
Est. Value
About This Home
This home is located at 539 N 9th St, Miamisburg, OH 45342 and is currently estimated at $143,725, approximately $159 per square foot. 539 N 9th St is a home located in Montgomery County with nearby schools including Miamisburg High School and Bethel Baptist School.
Ownership History
Date
Name
Owned For
Owner Type
Purchase Details
Closed on
Jun 9, 2005
Sold by
Gamble Simon
Bought by
Horton Michelle F
Current Estimated Value
Home Financials for this Owner
Home Financials are based on the most recent Mortgage that was taken out on this home.
Original Mortgage
$60,000
Outstanding Balance
$31,625
Interest Rate
5.91%
Mortgage Type
Fannie Mae Freddie Mac
Estimated Equity
$112,100
Purchase Details
Closed on
Apr 23, 1999
Sold by
Simon Gamble
Bought by
Gamble Simon and Simon Gamble Trust
Purchase Details
Closed on
Oct 27, 1995
Sold by
Lynch Stella M
Bought by
Gamble Simon
Create a Home Valuation Report for This Property
The Home Valuation Report is an in-depth analysis detailing your home's value as well as a comparison with similar homes in the area
Home Values in the Area
Average Home Value in this Area
Purchase History
| Date | Buyer | Sale Price | Title Company |
|---|---|---|---|
| Horton Michelle F | $75,000 | -- | |
| Gamble Simon | -- | -- | |
| Gamble Simon | $70,000 | -- |
Source: Public Records
Mortgage History
| Date | Status | Borrower | Loan Amount |
|---|---|---|---|
| Open | Horton Michelle F | $60,000 |
Source: Public Records
Tax History Compared to Growth
Tax History
| Year | Tax Paid | Tax Assessment Tax Assessment Total Assessment is a certain percentage of the fair market value that is determined by local assessors to be the total taxable value of land and additions on the property. | Land | Improvement |
|---|---|---|---|---|
| 2024 | $2,460 | $37,720 | $5,400 | $32,320 |
| 2023 | $2,460 | $37,720 | $5,400 | $32,320 |
| 2022 | $2,030 | $26,200 | $3,750 | $22,450 |
| 2021 | $1,803 | $26,200 | $3,750 | $22,450 |
| 2020 | $1,799 | $26,200 | $3,750 | $22,450 |
| 2019 | $1,713 | $22,880 | $3,750 | $19,130 |
| 2018 | $1,719 | $22,880 | $3,750 | $19,130 |
| 2017 | $1,708 | $22,880 | $3,750 | $19,130 |
| 2016 | $1,695 | $22,480 | $3,750 | $18,730 |
| 2015 | $1,697 | $22,480 | $3,750 | $18,730 |
| 2014 | $1,662 | $22,480 | $3,750 | $18,730 |
| 2012 | -- | $26,750 | $5,570 | $21,180 |
Source: Public Records
Map
Nearby Homes
- 948 Kercher St
- 816 E Pearl St
- 555 E Sycamore St
- 832 E Maple Ave
- 607 E Central Ave
- 740 E Central Ave
- 24 S 8th St
- 1121 Dayket Cir
- 1123 E Maple Ave Unit 1121
- 736 Park Ave
- 1137 E Pearl St
- 1131 E Central Ave
- 319 N 1st St
- 805 E Linden Ave
- 1232 Hollyhill Dr
- 235 S 7th St
- 619 Jefferson St
- 42 S Main St
- 513 Mound Ave
- 111 S Main St