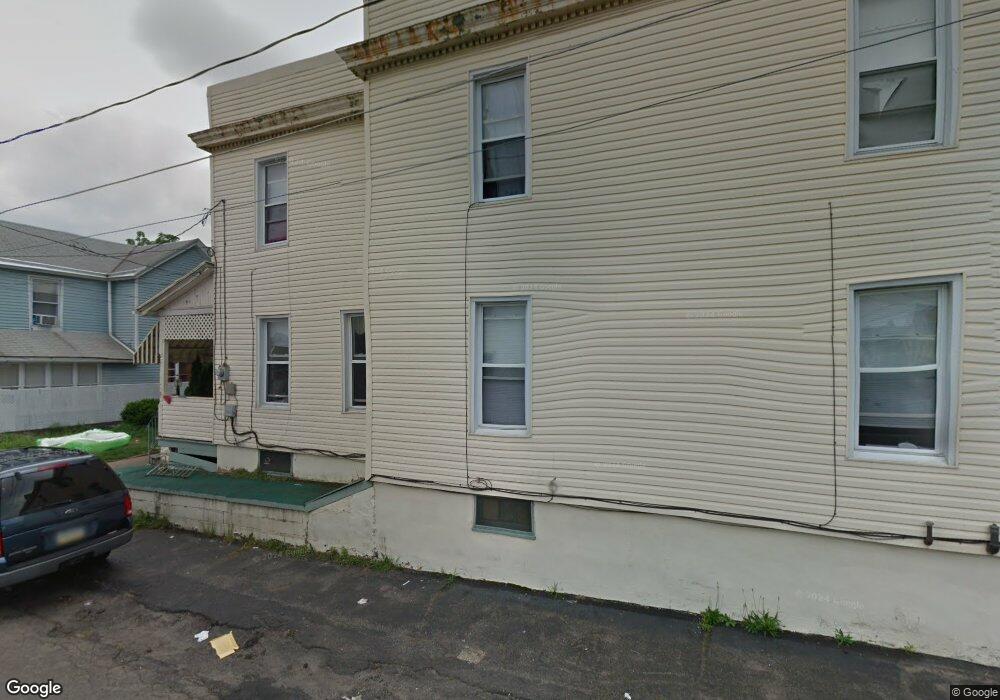
539 N James St Hazleton, PA 18201
Estimated Value: $103,000 - $164,000
3
Beds
2
Baths
1,354
Sq Ft
$95/Sq Ft
Est. Value
About This Home
This home is located at 539 N James St, Hazleton, PA 18201 and is currently estimated at $128,417, approximately $94 per square foot. 539 N James St is a home located in Luzerne County with nearby schools including Hazleton Area High School, Immanuel Christian School, and Holy Family Academy.
Ownership History
Date
Name
Owned For
Owner Type
Purchase Details
Closed on
Nov 16, 2020
Sold by
M & H Properties Llc
Bought by
Santos Ventura
Current Estimated Value
Purchase Details
Closed on
Jan 21, 2005
Sold by
Steibler Joan
Bought by
M & H Properties Llc
Home Financials for this Owner
Home Financials are based on the most recent Mortgage that was taken out on this home.
Original Mortgage
$34,125
Interest Rate
6%
Mortgage Type
Adjustable Rate Mortgage/ARM
Create a Home Valuation Report for This Property
The Home Valuation Report is an in-depth analysis detailing your home's value as well as a comparison with similar homes in the area
Home Values in the Area
Average Home Value in this Area
Purchase History
| Date | Buyer | Sale Price | Title Company |
|---|---|---|---|
| Santos Ventura | $53,000 | Toma Abstract Inc | |
| M & H Properties Llc | $45,500 | None Available |
Source: Public Records
Mortgage History
| Date | Status | Borrower | Loan Amount |
|---|---|---|---|
| Previous Owner | M & H Properties Llc | $34,125 |
Source: Public Records
Tax History Compared to Growth
Tax History
| Year | Tax Paid | Tax Assessment Tax Assessment Total Assessment is a certain percentage of the fair market value that is determined by local assessors to be the total taxable value of land and additions on the property. | Land | Improvement |
|---|---|---|---|---|
| 2025 | $1,807 | $62,900 | $20,200 | $42,700 |
| 2024 | $1,693 | $62,900 | $20,200 | $42,700 |
| 2023 | $1,583 | $62,900 | $20,200 | $42,700 |
| 2022 | $1,571 | $62,900 | $20,200 | $42,700 |
| 2021 | $1,535 | $62,900 | $20,200 | $42,700 |
| 2020 | $1,371 | $62,900 | $20,200 | $42,700 |
| 2019 | $1,415 | $62,900 | $20,200 | $42,700 |
| 2018 | $1,367 | $62,900 | $20,200 | $42,700 |
| 2017 | $1,260 | $62,900 | $20,200 | $42,700 |
| 2016 | $896 | $62,900 | $20,200 | $42,700 |
| 2015 | -- | $62,900 | $20,200 | $42,700 |
| 2014 | -- | $62,900 | $20,200 | $42,700 |
Source: Public Records
Map
Nearby Homes
- 522 N James St
- 1087 N Rear Locust St
- 731 W 1st St
- 572 N Vine St
- 714 Alter St
- 163 N Church St
- 530 N Lee Ct
- 127 W Diamond Ave
- 1 W Diamond Ave
- 756 Peace St
- 590 Mckinley St
- 782 N James St
- 56 N Laurel St
- 523 N Laurel St
- 52 N Laurel St
- ER.126 W Aspen St
- 667 Roosevelt St
- 14 W 5th St
- 739 N Church St
- 118 E Green St