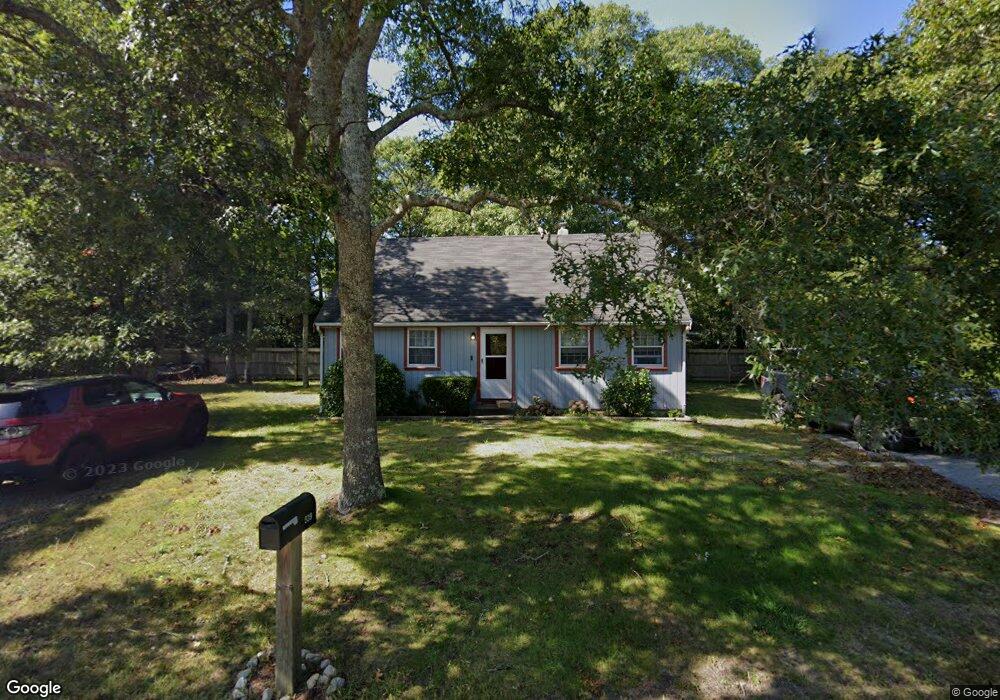
539 Old Strawberry Hill Rd Centerville, MA 02632
Centerville NeighborhoodEstimated Value: $479,000 - $597,000
2
Beds
1
Bath
994
Sq Ft
$522/Sq Ft
Est. Value
About This Home
This home is located at 539 Old Strawberry Hill Rd, Centerville, MA 02632 and is currently estimated at $519,146, approximately $522 per square foot. 539 Old Strawberry Hill Rd is a home located in Barnstable County with nearby schools including Centerville Elementary School, Barnstable United Elementary School, and Barnstable Intermediate School.
Ownership History
Date
Name
Owned For
Owner Type
Purchase Details
Closed on
Jun 22, 1993
Sold by
First Nb Boston
Bought by
Ponton Richard A
Current Estimated Value
Home Financials for this Owner
Home Financials are based on the most recent Mortgage that was taken out on this home.
Original Mortgage
$38,700
Interest Rate
7.38%
Mortgage Type
Purchase Money Mortgage
Purchase Details
Closed on
Nov 18, 1992
Sold by
Crane John Patrick
Bought by
First Natl Bk Boston
Purchase Details
Closed on
Jun 6, 1988
Sold by
Bono Elvira B
Bought by
Crane John Patrick
Home Financials for this Owner
Home Financials are based on the most recent Mortgage that was taken out on this home.
Original Mortgage
$100,000
Interest Rate
10.24%
Mortgage Type
Purchase Money Mortgage
Create a Home Valuation Report for This Property
The Home Valuation Report is an in-depth analysis detailing your home's value as well as a comparison with similar homes in the area
Home Values in the Area
Average Home Value in this Area
Purchase History
| Date | Buyer | Sale Price | Title Company |
|---|---|---|---|
| Ponton Richard A | $48,410 | -- | |
| First Natl Bk Boston | $52,850 | -- | |
| Crane John Patrick | $114,000 | -- |
Source: Public Records
Mortgage History
| Date | Status | Borrower | Loan Amount |
|---|---|---|---|
| Closed | Ponton Richard A | $38,700 | |
| Previous Owner | Crane John Patrick | $100,000 |
Source: Public Records
Tax History
| Year | Tax Paid | Tax Assessment Tax Assessment Total Assessment is a certain percentage of the fair market value that is determined by local assessors to be the total taxable value of land and additions on the property. | Land | Improvement |
|---|---|---|---|---|
| 2025 | $3,736 | $403,000 | $144,300 | $258,700 |
| 2024 | $3,493 | $386,000 | $144,300 | $241,700 |
| 2023 | $3,303 | $345,100 | $131,200 | $213,900 |
| 2022 | $3,220 | $278,300 | $97,200 | $181,100 |
| 2021 | $3,011 | $252,800 | $97,200 | $155,600 |
| 2020 | $3,054 | $247,700 | $97,200 | $150,500 |
| 2019 | $2,900 | $230,500 | $97,200 | $133,300 |
| 2018 | $2,683 | $218,100 | $102,300 | $115,800 |
| 2017 | $2,555 | $213,100 | $102,300 | $110,800 |
| 2016 | $2,534 | $216,000 | $105,200 | $110,800 |
| 2015 | $2,412 | $208,500 | $99,700 | $108,800 |
Source: Public Records
Map
Nearby Homes
- 522 Lincoln Road Extension
- 423 Lincoln Road Extension
- 21 Brian Ln
- 140 Wequaquet Ln
- 800 Bearses Way Unit 2SB
- 800 Bearses Way Unit 3NF
- 800 Bearses Way Unit 5NB
- 800 Bearses Way Unit 5NB
- 1029 Iyannough Rd Unit B BLDG 8
- 720 Pitchers Way Unit 52
- 720 Pitchers Way Unit 40
- 210 Attucks Ln
- 230 Attucks Ln
- 357 Lakeside Dr W
- 75 Olander Dr
- 75 Olander Dr
- 481 Lakeside Dr W
- 10 Sail -A-way
- 10 Sail a Way
- 5 Chickadee Ln
- 553 Old Strawberry Hill Rd
- 71 Midway Dr
- 544 Old Strawberry Hill Rd
- 525 Old Strawberry Hill Rd
- 110 Bishops Terrace
- 73 Midway Dr
- 554 Old Strawberry Hill Rd
- 156 Sunny Wood Dr
- 156 Sunnywood Dr
- 63 Midway Dr
- 100 Bishops Terrace
- 563 Old Strawberry Hill Rd
- 129 Sunnywood Dr
- 562 Old Strawberry Hill Rd
- 129 Sunny Wood Dr
- 78 Midway Dr
- 142 Sunny Wood Dr
- 142 Sunnywood Dr
- 6 Anthony Dr
- 120 Bishops Terrace
Your Personal Tour Guide
Ask me questions while you tour the home.