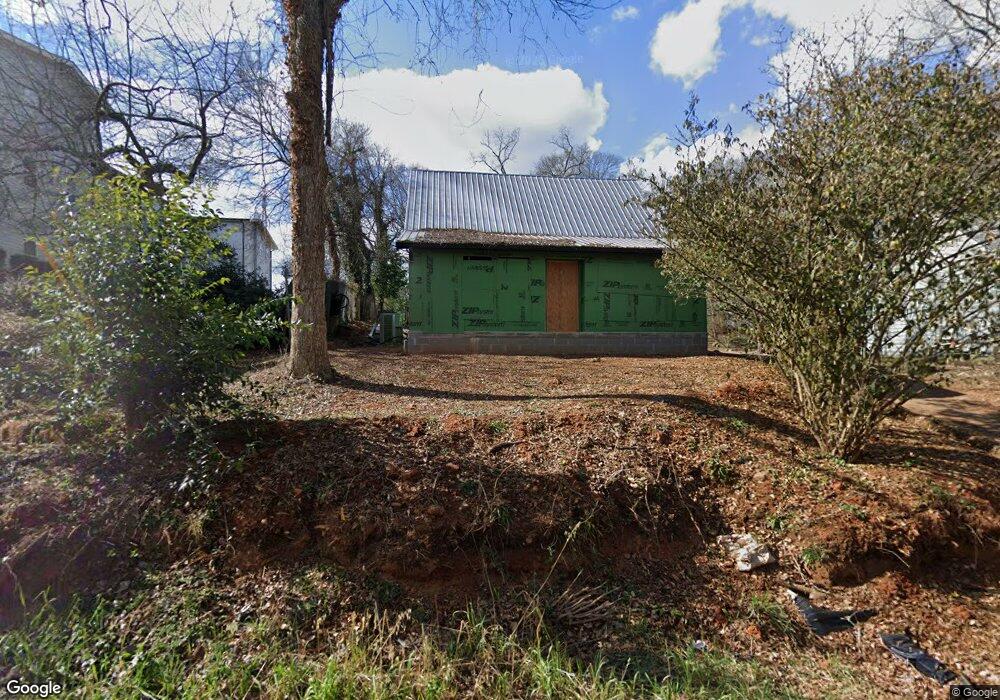
539 Pulaski St Athens, GA 30601
Newtown NeighborhoodEstimated Value: $540,000 - $713,000
4
Beds
3
Baths
2,137
Sq Ft
$288/Sq Ft
Est. Value
About This Home
This home is located at 539 Pulaski St, Athens, GA 30601 and is currently estimated at $616,017, approximately $288 per square foot. 539 Pulaski St is a home located in Clarke County with nearby schools including Johnnie Lay Burks Elementary School, Clarke Middle School, and Clarke Central High School.
Ownership History
Date
Name
Owned For
Owner Type
Purchase Details
Closed on
Sep 20, 2017
Sold by
Allen Corinne C
Bought by
Stabler John Allen and Stabler Layne
Current Estimated Value
Purchase Details
Closed on
Aug 3, 2009
Sold by
Opportunity Holdings Llc
Bought by
Allen Corinne C
Purchase Details
Closed on
Jul 26, 2006
Sold by
Not Provided
Bought by
Allen Corinne C and Harold Lee Smith
Home Financials for this Owner
Home Financials are based on the most recent Mortgage that was taken out on this home.
Original Mortgage
$337,500
Interest Rate
6.74%
Mortgage Type
New Conventional
Purchase Details
Closed on
Feb 29, 2000
Sold by
Tillman Billups P
Bought by
Leavell Glenn and Linda Leavell
Purchase Details
Closed on
Dec 17, 1998
Sold by
Tillman Thomas M
Bought by
Tillman Billups P
Purchase Details
Closed on
Aug 15, 1990
Sold by
Tillman Thomas M Sr By Executor
Bought by
Tillman Thomas M
Create a Home Valuation Report for This Property
The Home Valuation Report is an in-depth analysis detailing your home's value as well as a comparison with similar homes in the area
Home Values in the Area
Average Home Value in this Area
Purchase History
| Date | Buyer | Sale Price | Title Company |
|---|---|---|---|
| Stabler John Allen | $300,000 | -- | |
| Allen Corinne C | -- | -- | |
| Allen Corinne C | $225,000 | -- | |
| Leavell Glenn | $119,500 | -- | |
| Tillman Billups P | -- | -- | |
| Tillman Thomas M | -- | -- |
Source: Public Records
Mortgage History
| Date | Status | Borrower | Loan Amount |
|---|---|---|---|
| Previous Owner | Allen Corinne C | $337,500 |
Source: Public Records
Tax History Compared to Growth
Tax History
| Year | Tax Paid | Tax Assessment Tax Assessment Total Assessment is a certain percentage of the fair market value that is determined by local assessors to be the total taxable value of land and additions on the property. | Land | Improvement |
|---|---|---|---|---|
| 2025 | $4,998 | $160,961 | $38,000 | $122,961 |
| 2024 | $4,998 | $229,201 | $38,000 | $191,201 |
| 2023 | $7,163 | $211,951 | $38,000 | $173,951 |
| 2022 | $5,971 | $187,182 | $38,000 | $149,182 |
| 2021 | $5,413 | $160,611 | $38,000 | $122,611 |
| 2020 | $5,097 | $151,257 | $34,200 | $117,057 |
| 2019 | $4,820 | $141,977 | $34,200 | $107,777 |
| 2018 | $4,141 | $121,966 | $34,200 | $87,766 |
| 2017 | $3,654 | $107,617 | $34,200 | $73,417 |
| 2016 | $3,277 | $96,535 | $34,200 | $62,335 |
| 2015 | $3,245 | $95,426 | $34,200 | $61,226 |
| 2014 | $2,931 | $86,086 | $30,400 | $55,686 |
Source: Public Records
Map
Nearby Homes
- 559 Pulaski St
- 100 Prince Ave Unit A404
- 100 Prince Ave Unit A407
- 600 Pulaski St
- 668 Pulaski St
- 145 Hendrix Ave
- 570 Prince Ave
- 257 Hill St
- 250 W Broad St Unit 811
- 250 W Broad St Unit 521
- 250 W Broad St Unit 408
- 250 W Broad St Unit 615
- 131 E Broad St Unit 707
- 270 Atlanta Ave
- 468 N Milledge Ave Unit 203
- 195 Beulah Ave
- 697 Barber St
- 239 Madison Heights
- 552 Cobb St
- 545 Pulaski St
- 100 Prince Ave
- 100 Prince Ave
- 541 Pulaski St
- 538 Pulaski St
- 542 Pulaski St
- 534 Pulaski St
- 543 Pulaski St
- 530 Pulaski St
- 553 Pulaski St Unit B
- 553 Pulaski St Unit A
- 552 Pulaski St
- 526 Pulaski St
- 558 Pulaski St
- 559 Pulaski St Unit 1-3
- 559 Pulaski St Unit 1
- 559 Pulaski St
- 160.5 Pulaski St
- 562 Pulaski St
- 510 Pulaski St