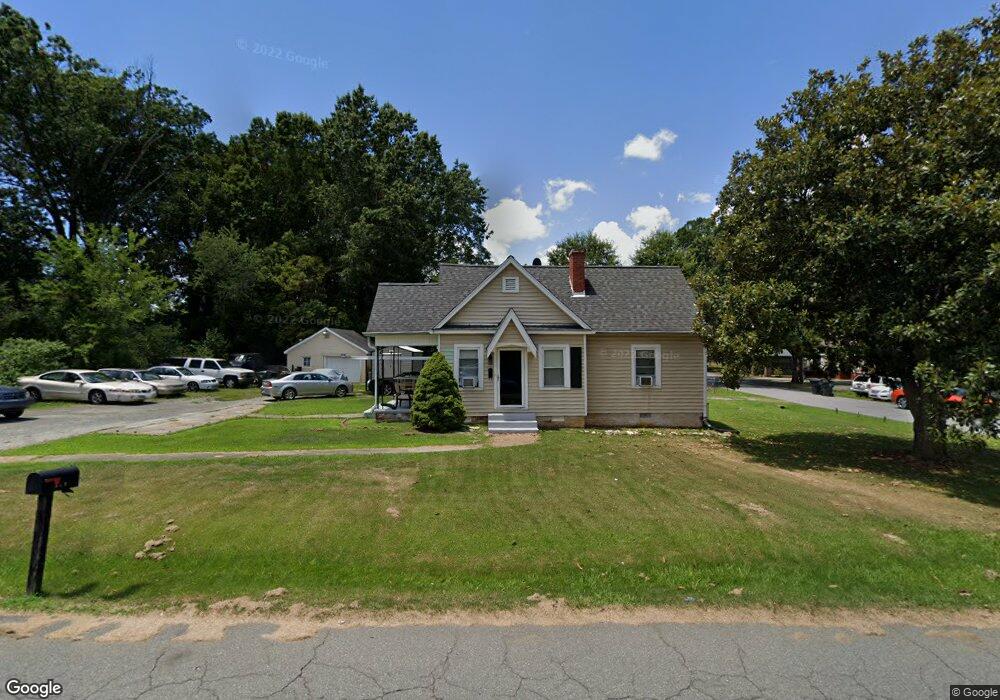
539 Queen Ann St Burlington, NC 27217
East Burlington NeighborhoodEstimated Value: $134,000 - $176,212
3
Beds
2
Baths
1,016
Sq Ft
$153/Sq Ft
Est. Value
About This Home
This home is located at 539 Queen Ann St, Burlington, NC 27217 and is currently estimated at $155,553, approximately $153 per square foot. 539 Queen Ann St is a home located in Alamance County with nearby schools including Eastlawn Elementary School, Broadview Middle School, and Hugh M. Cummings High School.
Ownership History
Date
Name
Owned For
Owner Type
Purchase Details
Closed on
Oct 2, 2019
Sold by
Blackwell Shelton Lamar
Bought by
Ector Amy Michelle
Current Estimated Value
Purchase Details
Closed on
May 19, 2015
Sold by
539 Queen Ann Residential Land
Bought by
Blackwell Shelton R
Home Financials for this Owner
Home Financials are based on the most recent Mortgage that was taken out on this home.
Original Mortgage
$65,000
Interest Rate
3.77%
Mortgage Type
New Conventional
Purchase Details
Closed on
Jan 1, 1990
Bought by
539 Queen Ann Residential Land
Create a Home Valuation Report for This Property
The Home Valuation Report is an in-depth analysis detailing your home's value as well as a comparison with similar homes in the area
Home Values in the Area
Average Home Value in this Area
Purchase History
| Date | Buyer | Sale Price | Title Company |
|---|---|---|---|
| Ector Amy Michelle | -- | None Available | |
| Blackwell Shelton R | $65,000 | -- | |
| 539 Queen Ann Residential Land | -- | -- |
Source: Public Records
Mortgage History
| Date | Status | Borrower | Loan Amount |
|---|---|---|---|
| Previous Owner | Blackwell Shelton R | $65,000 |
Source: Public Records
Tax History Compared to Growth
Tax History
| Year | Tax Paid | Tax Assessment Tax Assessment Total Assessment is a certain percentage of the fair market value that is determined by local assessors to be the total taxable value of land and additions on the property. | Land | Improvement |
|---|---|---|---|---|
| 2025 | $853 | $172,621 | $15,000 | $157,621 |
| 2024 | $810 | $172,621 | $15,000 | $157,621 |
| 2023 | $1,573 | $172,621 | $15,000 | $157,621 |
| 2022 | $943 | $75,995 | $15,000 | $60,995 |
| 2021 | $951 | $75,995 | $15,000 | $60,995 |
| 2020 | $958 | $75,995 | $15,000 | $60,995 |
| 2019 | $961 | $75,995 | $15,000 | $60,995 |
| 2018 | $452 | $75,995 | $15,000 | $60,995 |
| 2017 | $895 | $75,995 | $15,000 | $60,995 |
| 2016 | $780 | $67,279 | $15,000 | $52,279 |
| 2015 | $391 | $67,692 | $15,000 | $52,692 |
| 2014 | -- | $67,692 | $15,000 | $52,692 |
Source: Public Records
Map
Nearby Homes
- 520 Delaware Ave
- 506 Piedmont Way
- 517 Jones St
- 725 S Beaumont Ave
- 918 Harris St
- 625 Columbia Ave
- 924 E Market St
- 208 S Saint John St
- 213 Columbia Ave
- 801 N Mebane St
- 505 Brookline Dr
- 625 N Mebane St
- 616 N Mebane St
- 178 Gilmer St
- 813 N Main St
- 1726 Oklahoma Ave
- 119 N Anthony St
- 1605 Hanover Rd
- 1214 Queen Ann St
- 1509 Vaughn Rd
- 1115 Stonewall Ave
- 545 Queen Ann St
- 1111 Stonewall Ave
- 529 Queen Ann St
- 1128 Elwood St
- 1111 Stonewall St
- 1124 Elwood St
- 540 Queen Ann St
- 1107 Stonewall Ave
- 1107 Stonewall St
- 1122 Elwood St
- 1106 Stonewall Ave
- 527 Queen Ann St
- 544 Queen Ann St
- 1204 Elwood Ct
- 530 Queen Ann St
- 1103 Stonewall Ave
- 1104 Stonewall Ave
- 1120 Elwood St
- 523 Queen Ann St