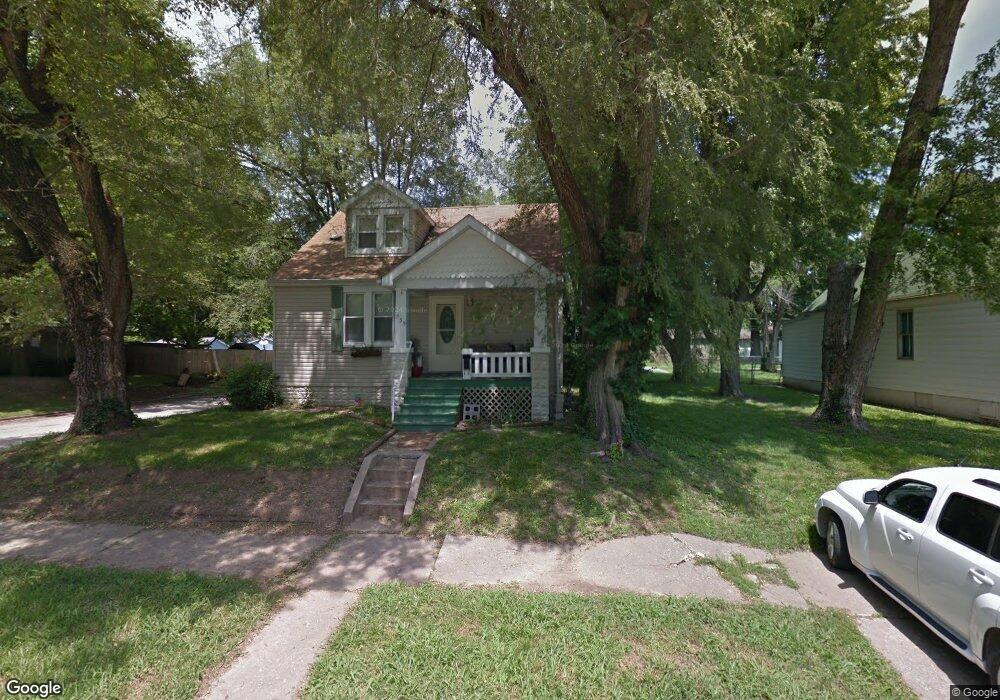
539 S 21st St Belleville, IL 62226
Estimated Value: $85,000 - $120,000
--
Bed
--
Bath
896
Sq Ft
$116/Sq Ft
Est. Value
About This Home
This home is located at 539 S 21st St, Belleville, IL 62226 and is currently estimated at $103,577, approximately $115 per square foot. 539 S 21st St is a home located in St. Clair County with nearby schools including Union Elementary School, West Jr High School, and Governor French Academy.
Ownership History
Date
Name
Owned For
Owner Type
Purchase Details
Closed on
Feb 24, 2025
Sold by
Intercounty Judicial Sales Corp
Bought by
Bank Of New York Mellon Trust Co
Current Estimated Value
Purchase Details
Closed on
Jun 21, 2005
Sold by
Zrenner John
Bought by
Graham Tami A
Home Financials for this Owner
Home Financials are based on the most recent Mortgage that was taken out on this home.
Original Mortgage
$75,000
Interest Rate
5.87%
Mortgage Type
Fannie Mae Freddie Mac
Purchase Details
Closed on
Jan 12, 2005
Sold by
Kronenberger Melanie
Bought by
Zrenner John
Create a Home Valuation Report for This Property
The Home Valuation Report is an in-depth analysis detailing your home's value as well as a comparison with similar homes in the area
Home Values in the Area
Average Home Value in this Area
Purchase History
| Date | Buyer | Sale Price | Title Company |
|---|---|---|---|
| Bank Of New York Mellon Trust Co | -- | None Available | |
| Graham Tami A | $75,000 | Town & Country Title Co | |
| Zrenner John | $18,500 | Town & Country Title Co |
Source: Public Records
Mortgage History
| Date | Status | Borrower | Loan Amount |
|---|---|---|---|
| Previous Owner | Graham Tami A | $75,000 |
Source: Public Records
Tax History Compared to Growth
Tax History
| Year | Tax Paid | Tax Assessment Tax Assessment Total Assessment is a certain percentage of the fair market value that is determined by local assessors to be the total taxable value of land and additions on the property. | Land | Improvement |
|---|---|---|---|---|
| 2024 | $2,227 | $25,320 | $2,054 | $23,266 |
| 2023 | $2,502 | $26,653 | $2,013 | $24,640 |
| 2022 | $2,297 | $23,994 | $1,812 | $22,182 |
| 2021 | $2,212 | $22,182 | $1,675 | $20,507 |
| 2020 | $2,150 | $20,977 | $1,584 | $19,393 |
| 2019 | $2,383 | $23,001 | $1,587 | $21,414 |
| 2018 | $2,330 | $22,504 | $1,553 | $20,951 |
| 2017 | $2,312 | $22,346 | $1,542 | $20,804 |
| 2016 | $2,283 | $21,871 | $1,509 | $20,362 |
| 2014 | $1,980 | $21,414 | $1,552 | $19,862 |
| 2013 | $1,959 | $21,720 | $1,574 | $20,146 |
Source: Public Records
Map
Nearby Homes