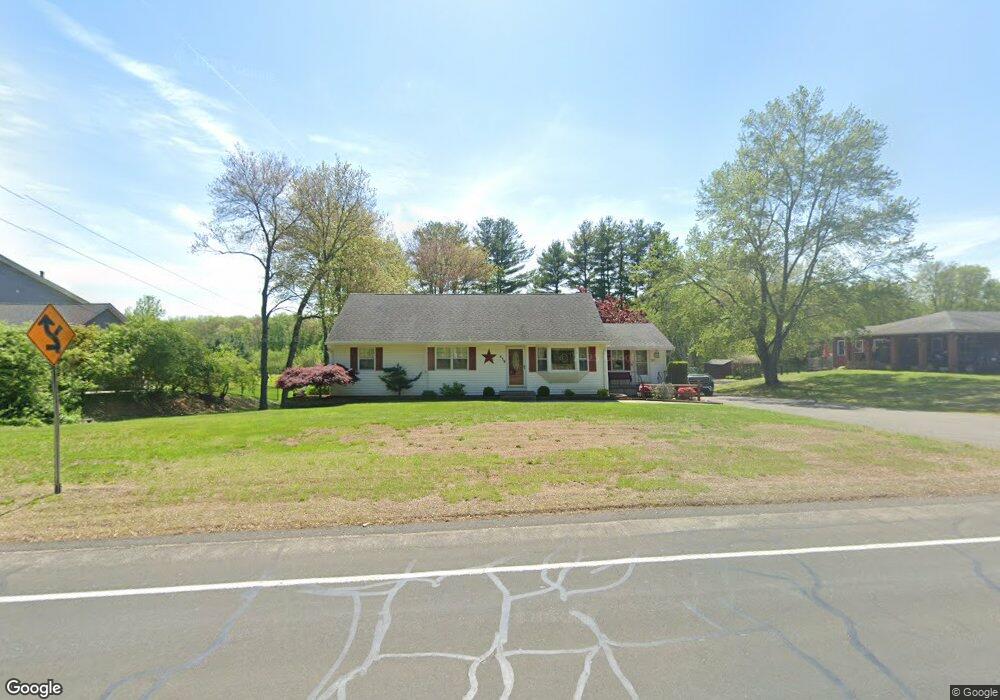
539 Shoemaker Ln Agawam, MA 01001
Estimated Value: $397,000 - $481,217
3
Beds
2
Baths
1,626
Sq Ft
$268/Sq Ft
Est. Value
About This Home
This home is located at 539 Shoemaker Ln, Agawam, MA 01001 and is currently estimated at $435,406, approximately $267 per square foot. 539 Shoemaker Ln is a home located in Hampden County with nearby schools including Agawam Junior High School and Agawam High School.
Ownership History
Date
Name
Owned For
Owner Type
Purchase Details
Closed on
May 30, 2024
Sold by
Fearn Farm Rt and Fearn
Bought by
Fearn Farm Irt and Fearn
Current Estimated Value
Purchase Details
Closed on
Jan 11, 2011
Sold by
Fearn Robert G and Fearn David K
Bought by
Fearn Farm Rt and Fearn
Purchase Details
Closed on
May 14, 2003
Sold by
Fearn Muriel R and Fearn Robert G
Bought by
Fearn David K and Santos Judith L
Create a Home Valuation Report for This Property
The Home Valuation Report is an in-depth analysis detailing your home's value as well as a comparison with similar homes in the area
Home Values in the Area
Average Home Value in this Area
Purchase History
| Date | Buyer | Sale Price | Title Company |
|---|---|---|---|
| Fearn Farm Irt | -- | None Available | |
| Fearn Farm Irt | -- | None Available | |
| Fearn Farm Rt | -- | -- | |
| Fearn Farm Rt | -- | -- | |
| Fearn David K | -- | -- | |
| Fearn David K | -- | -- |
Source: Public Records
Tax History Compared to Growth
Tax History
| Year | Tax Paid | Tax Assessment Tax Assessment Total Assessment is a certain percentage of the fair market value that is determined by local assessors to be the total taxable value of land and additions on the property. | Land | Improvement |
|---|---|---|---|---|
| 2025 | -- | $360,763 | $124,263 | $236,500 |
| 2024 | -- | $348,713 | $124,713 | $224,000 |
| 2023 | $0 | $301,830 | $112,730 | $189,100 |
| 2022 | $4,289 | $284,447 | $112,947 | $171,500 |
| 2021 | $4,289 | $249,484 | $100,184 | $149,300 |
| 2020 | $4,289 | $242,384 | $98,584 | $143,800 |
| 2019 | $4,053 | $237,620 | $96,420 | $141,200 |
| 2018 | $3,755 | $220,873 | $91,073 | $129,800 |
| 2017 | $3,267 | $213,929 | $90,629 | $123,300 |
| 2016 | $3,267 | $208,940 | $90,540 | $118,400 |
| 2015 | $3,267 | $203,721 | $90,021 | $113,700 |
Source: Public Records
Map
Nearby Homes
- 907 Shoemaker Ln
- 61-63 Orlando St
- 30 Rising St
- 441 Silver St
- 36-38 Orlando St
- 309 Poplar St
- 236 S Westfield St
- 8 Ash Ln
- 33 Dogwood Ln
- 215 Barry St
- 92 Highland St
- 48 Cosgrove Ave
- 31 Cosgrove Ave
- 42 Lakeview Cir
- 73 Silver Lake Dr
- 25 Castle Hill Rd Unit E
- 8 Independence Rd
- 1 Castle Hill Rd Unit D
- 15 B Castle Hills Rd Unit B
- 4 H Castle Hills Rd Unit H