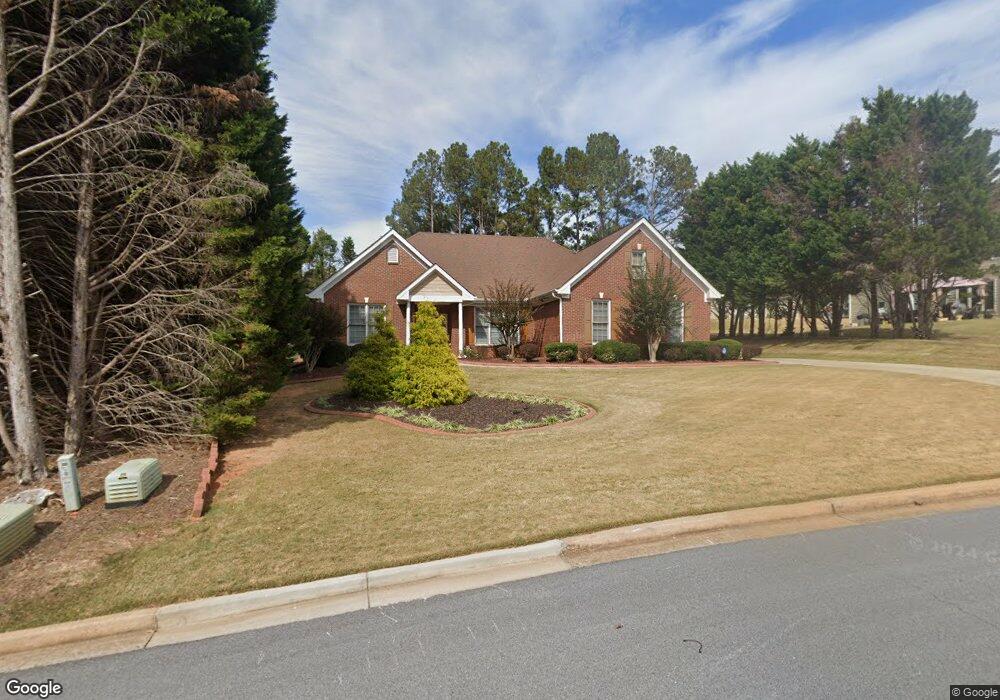
539 Trotters Ln SE Unit 3 Conyers, GA 30094
Estimated Value: $337,133 - $409,000
3
Beds
3
Baths
2,427
Sq Ft
$152/Sq Ft
Est. Value
About This Home
This home is located at 539 Trotters Ln SE Unit 3, Conyers, GA 30094 and is currently estimated at $368,283, approximately $151 per square foot. 539 Trotters Ln SE Unit 3 is a home located in Rockdale County with nearby schools including Barksdale Elementary School, Gen. Ray Davis Middle School, and Heritage High School.
Ownership History
Date
Name
Owned For
Owner Type
Purchase Details
Closed on
Sep 21, 2018
Sold by
Ramcheran Patricia
Bought by
Ramcheran Alvin and Ramcheran Patricia
Current Estimated Value
Purchase Details
Closed on
Nov 11, 1999
Sold by
Stovall Martin S and Stovall Lauren C
Bought by
Ramcheran Patricia
Home Financials for this Owner
Home Financials are based on the most recent Mortgage that was taken out on this home.
Original Mortgage
$161,500
Interest Rate
7.7%
Mortgage Type
New Conventional
Purchase Details
Closed on
May 1, 1998
Sold by
Davidson Investment Inc
Bought by
Stovall Martin S and Stovall Lauren
Create a Home Valuation Report for This Property
The Home Valuation Report is an in-depth analysis detailing your home's value as well as a comparison with similar homes in the area
Home Values in the Area
Average Home Value in this Area
Purchase History
| Date | Buyer | Sale Price | Title Company |
|---|---|---|---|
| Ramcheran Alvin | -- | -- | |
| Ramcheran Patricia | $166,500 | -- | |
| Stovall Martin S | $154,900 | -- |
Source: Public Records
Mortgage History
| Date | Status | Borrower | Loan Amount |
|---|---|---|---|
| Previous Owner | Ramcheran Patricia | $161,500 | |
| Closed | Stovall Martin S | -- |
Source: Public Records
Tax History Compared to Growth
Tax History
| Year | Tax Paid | Tax Assessment Tax Assessment Total Assessment is a certain percentage of the fair market value that is determined by local assessors to be the total taxable value of land and additions on the property. | Land | Improvement |
|---|---|---|---|---|
| 2024 | $2,503 | $129,280 | $27,800 | $101,480 |
| 2023 | $2,300 | $126,760 | $29,280 | $97,480 |
| 2022 | $2,252 | $112,600 | $26,600 | $86,000 |
| 2021 | $1,689 | $86,760 | $15,280 | $71,480 |
| 2020 | $1,713 | $86,760 | $15,280 | $71,480 |
| 2019 | $1,417 | $75,440 | $13,280 | $62,160 |
| 2018 | $1,581 | $64,400 | $12,600 | $51,800 |
| 2017 | $1,591 | $64,040 | $11,720 | $52,320 |
| 2016 | $1,336 | $59,360 | $9,760 | $49,600 |
| 2015 | $1,323 | $58,800 | $9,200 | $49,600 |
| 2014 | $1,188 | $58,800 | $9,200 | $49,600 |
| 2013 | -- | $59,200 | $14,000 | $45,200 |
Source: Public Records
Map
Nearby Homes
- 530 Valley Woods Cir SE
- 201 Thorn Berry Way
- 605 Trophy Ln
- 724 Cowan Rd SE
- 450 Valley Woods Cir SE
- 455 Sweet Water Trail SE
- 586 Clubland Cir SE
- 303 Landon Dr SE
- 649 Sugar Creek Trail SE
- 599 Palmer Ct SE
- 610 Camary Ct SE
- 411 Willow Ct SE Unit 3
- 210 Cowan Rd SE
- 781 Sweet Briar Trail SE
- 0 Troupe Smith Rd SE Unit 10498299
- 0 Troupe Smith Rd SE Unit 7556149
- 3665 Clubhouse Ln SE
- 780 Sweet Briar Trail SE
- 3960 Highway 20 SE
- 537 Trotters Ln SE Unit 3
- 549 Trotters Ln SE
- 3806 Martingale Dr SE
- 535 Trotters Ln SE Unit 3
- 3804 Martingale Dr SE Unit 1
- 538 Trotters Ln SE
- 3802 Martingale Dr SE
- 3810 Martingale Dr SE Unit 2
- 533 Trotters Ln SE
- 536 Trotters Ln SE
- 530 Trotters Ln SE
- 528 Trotters Ln SE
- 3809 Martingale Dr SE
- 3807 Martingale Dr SE Unit 1
- 3805 Martingale Dr SE
- 3803 Martingale Dr SE
- 532 Trotters Ln SE
- 3800 Martingale Dr SE
- 526 Trotters Ln SE
- 534 Trotters Ln SE