Estimated Value: $213,000 - $252,000
3
Beds
2
Baths
1,555
Sq Ft
$153/Sq Ft
Est. Value
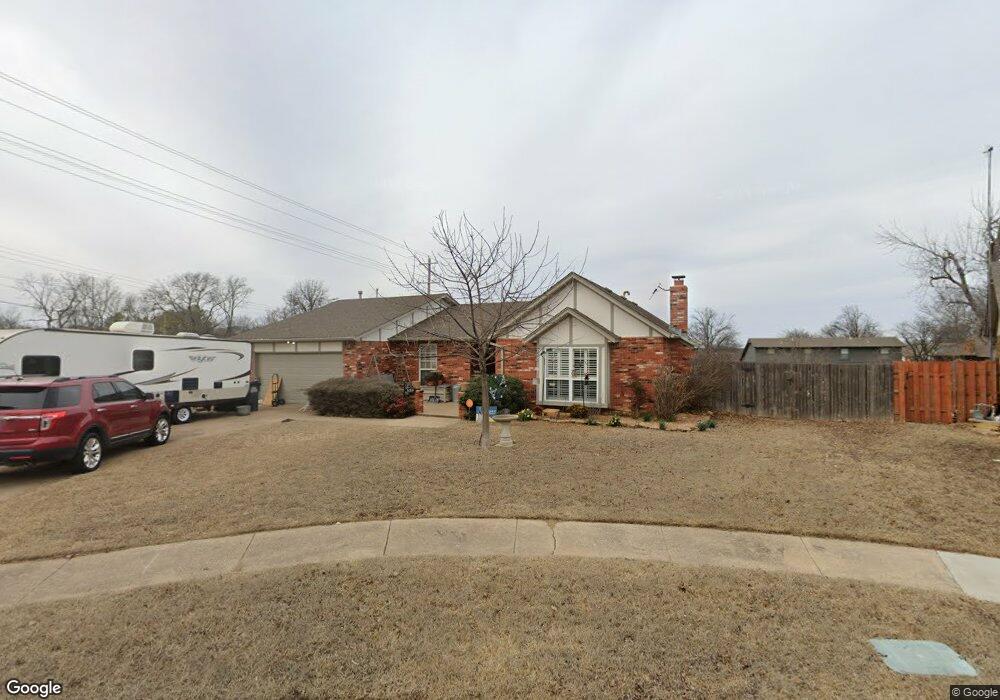
About This Home
This home is located at 539 W 113th Ct S, Jenks, OK 74037 and is currently estimated at $237,479, approximately $152 per square foot. 539 W 113th Ct S is a home located in Tulsa County with nearby schools including Jenks West Elementary School, Jenks West Intermediate Elementary School, and Jenks Middle School.
Ownership History
Date
Name
Owned For
Owner Type
Purchase Details
Closed on
Dec 17, 2008
Sold by
Kidd Beverly and Kidd Beverly Jo Gee
Bought by
Kidd Beverly Jo Gee and Beverly Jo Gee Kidd Revocable
Current Estimated Value
Purchase Details
Closed on
Jan 18, 2006
Sold by
Hud
Bought by
Kidd Beverly
Home Financials for this Owner
Home Financials are based on the most recent Mortgage that was taken out on this home.
Original Mortgage
$99,700
Interest Rate
6.24%
Mortgage Type
Fannie Mae Freddie Mac
Purchase Details
Closed on
Sep 14, 2005
Sold by
Green William D and Gomez Kasey Lyn
Bought by
Hud
Purchase Details
Closed on
Sep 26, 2003
Sold by
Mcquary Alan J and Mcquary Sheryl A
Bought by
Green William D
Home Financials for this Owner
Home Financials are based on the most recent Mortgage that was taken out on this home.
Original Mortgage
$105,169
Interest Rate
6.22%
Mortgage Type
Purchase Money Mortgage
Purchase Details
Closed on
Mar 1, 1988
Create a Home Valuation Report for This Property
The Home Valuation Report is an in-depth analysis detailing your home's value as well as a comparison with similar homes in the area
Home Values in the Area
Average Home Value in this Area
Purchase History
| Date | Buyer | Sale Price | Title Company |
|---|---|---|---|
| Kidd Beverly Jo Gee | -- | None Available | |
| Kidd Beverly | -- | First American Title | |
| Hud | -- | -- | |
| Green William D | $106,000 | -- | |
| -- | $65,500 | -- |
Source: Public Records
Mortgage History
| Date | Status | Borrower | Loan Amount |
|---|---|---|---|
| Closed | Kidd Beverly | $99,700 | |
| Previous Owner | Green William D | $105,169 |
Source: Public Records
Tax History Compared to Growth
Tax History
| Year | Tax Paid | Tax Assessment Tax Assessment Total Assessment is a certain percentage of the fair market value that is determined by local assessors to be the total taxable value of land and additions on the property. | Land | Improvement |
|---|---|---|---|---|
| 2024 | $1,671 | $13,551 | $2,164 | $11,387 |
| 2023 | $1,671 | $14,127 | $2,476 | $11,651 |
| 2022 | $1,635 | $12,715 | $3,403 | $9,312 |
| 2021 | $1,604 | $12,316 | $3,296 | $9,020 |
| 2020 | $1,519 | $11,928 | $3,192 | $8,736 |
| 2019 | $1,481 | $11,552 | $3,092 | $8,460 |
| 2018 | $1,444 | $11,186 | $2,484 | $8,702 |
| 2017 | $1,420 | $12,186 | $2,706 | $9,480 |
| 2016 | $1,429 | $11,985 | $2,661 | $9,324 |
| 2015 | $1,410 | $12,186 | $2,706 | $9,480 |
| 2014 | $1,396 | $12,069 | $2,706 | $9,363 |
Source: Public Records
Map
Nearby Homes
- 11265 S Fir Ave
- 11261 S Fir Ave
- 682 W 113th Ct S
- 691 W 113th Ct S
- 11264 S Fir Ave
- 11312 S Fir Ave
- 11308 S Fir Ave
- 11224 S Fir Ave
- 11260 S Fir Ave
- 11427 S Ash St
- 11207 S 1st St
- 10821 S Fir St
- 11304 S 2nd St
- 208 E 113th St S
- 10625 S Forest Ave
- 205 E 116th St
- 11220 S Fir Ave
- 11212 S Fir Ave
- 187 E 116th St
- 418 E 111th St S
- 535 W 113th Ct S
- 0 S Elm St Unit 727644
- 0 S Elm St Unit 310204
- 0 S Elm St Unit 932385
- 0 S Elm St Unit 1542728
- 0 S Elm St Unit 1601365
- 0 S Elm St Unit 1612062
- 0 S Elm St Unit 1634753
- 0 S Elm St Unit 1913858
- 0 S Elm St Unit 1913840
- 0 S Elm St Unit 1913865
- 548 W 112th Ct S
- 531 W 113th Ct S
- 544 W 112th Ct S
- 538 W 113th Ct S
- 6018 112th Place E
- 6012 112th Place E
- 6006 112th Place E
- 11352 S Date St
- 11364 S Date St