Estimated Value: $82,000 - $150,000
4
Beds
2
Baths
1,654
Sq Ft
$62/Sq Ft
Est. Value
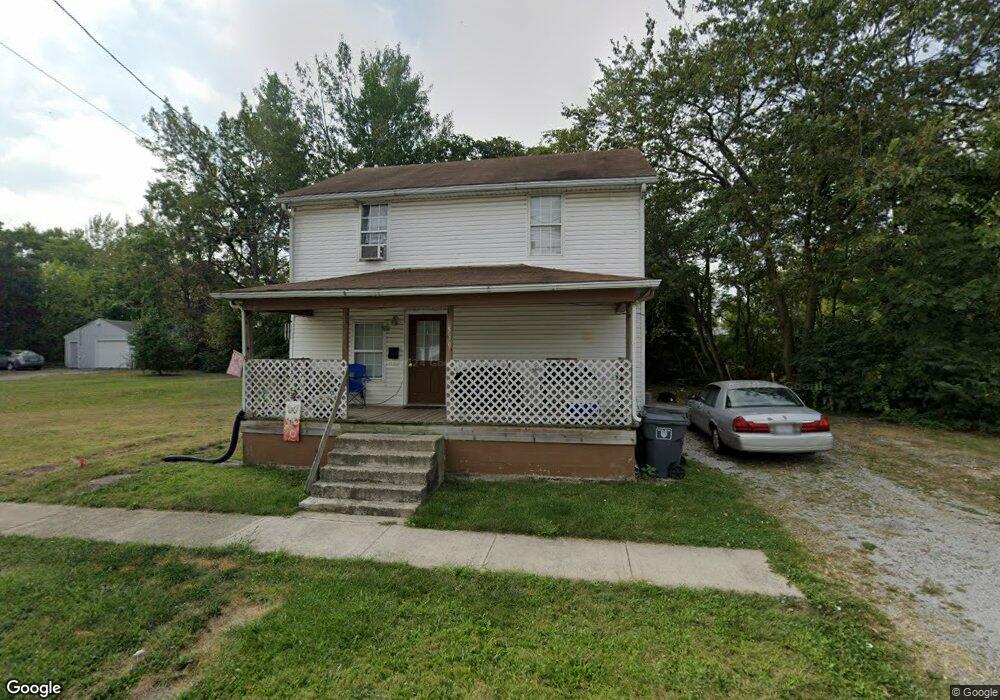
About This Home
This home is located at 539 W Mckibben St, Lima, OH 45801 and is currently estimated at $103,172, approximately $62 per square foot. 539 W Mckibben St is a home located in Allen County with nearby schools including Independence Elementary School, Lima North Middle School, and Lima West Middle School.
Ownership History
Date
Name
Owned For
Owner Type
Purchase Details
Closed on
Jun 7, 2002
Sold by
Cummings Jill A
Bought by
Reed Frederick F and Risser Susan K
Current Estimated Value
Purchase Details
Closed on
Mar 1, 1999
Sold by
Lyons Jeffrey
Bought by
Cummings Jason
Home Financials for this Owner
Home Financials are based on the most recent Mortgage that was taken out on this home.
Original Mortgage
$55,639
Interest Rate
6.92%
Mortgage Type
New Conventional
Purchase Details
Closed on
Jan 29, 1998
Sold by
Newland Viola
Bought by
Lyons Jeffrey
Home Financials for this Owner
Home Financials are based on the most recent Mortgage that was taken out on this home.
Original Mortgage
$5,090
Interest Rate
10.5%
Mortgage Type
New Conventional
Purchase Details
Closed on
Apr 8, 1994
Sold by
Jordan Phyllis
Bought by
Newland Viola S
Purchase Details
Closed on
Oct 16, 1992
Bought by
Jordan Phyllis
Create a Home Valuation Report for This Property
The Home Valuation Report is an in-depth analysis detailing your home's value as well as a comparison with similar homes in the area
Home Values in the Area
Average Home Value in this Area
Purchase History
| Date | Buyer | Sale Price | Title Company |
|---|---|---|---|
| Reed Frederick F | $22,437 | -- | |
| Cummings Jason | $55,639 | -- | |
| Lyons Jeffrey | $2,500 | -- | |
| Newland Viola S | $300 | -- | |
| Jordan Phyllis | $5,000 | -- |
Source: Public Records
Mortgage History
| Date | Status | Borrower | Loan Amount |
|---|---|---|---|
| Previous Owner | Cummings Jason | $55,639 | |
| Previous Owner | Lyons Jeffrey | $5,090 |
Source: Public Records
Tax History Compared to Growth
Tax History
| Year | Tax Paid | Tax Assessment Tax Assessment Total Assessment is a certain percentage of the fair market value that is determined by local assessors to be the total taxable value of land and additions on the property. | Land | Improvement |
|---|---|---|---|---|
| 2024 | $885 | $23,380 | $1,820 | $21,560 |
| 2023 | $804 | $18,420 | $1,440 | $16,980 |
| 2022 | $807 | $18,420 | $1,440 | $16,980 |
| 2021 | $855 | $18,420 | $1,440 | $16,980 |
| 2020 | $721 | $13,550 | $1,370 | $12,180 |
| 2019 | $721 | $13,550 | $1,370 | $12,180 |
| 2018 | $714 | $13,550 | $1,370 | $12,180 |
| 2017 | $724 | $13,550 | $1,370 | $12,180 |
| 2016 | $734 | $13,550 | $1,370 | $12,180 |
| 2015 | $747 | $13,550 | $1,370 | $12,180 |
| 2014 | $624 | $11,170 | $1,330 | $9,840 |
| 2013 | $609 | $11,170 | $1,330 | $9,840 |
Source: Public Records
Map
Nearby Homes
- 745 Brice Ave
- 627 Brice Ave
- 612 N Metcalf St
- 434 N Washington St
- 708 N Metcalf St
- 631 Hazel Ave
- 618 Woodward Ave
- 638 Hazel Ave
- 325 N McDonel St
- 648 Hazel Ave
- 416 Hazel Ave
- 606 N West St
- 576 Cortlandt Ave
- 14 House Package
- 1023 Leland Ave
- 676 Cortlandt Ave
- 616 N Elizabeth St
- 1120 Richie Ave
- 222 W Grand Ave
- 1036 W High St
- 523 W Mckibben St
- 521 W Mckibben St
- 538 W Mckibben St
- 540 W Mckibben St
- 542 W Mckibben St
- 522 W Mckibben St
- 519 W Mckibben St
- 530 W Mckibben St
- 518 W Mckibben St
- 515 W Mckibben St
- 516 W Mckibben St
- 512 W Mckibben St
- 733 Delphos Ave
- 741 Delphos Ave
- 537 N Metcalf St
- 510 W Mckibben St
- 535 N Metcalf St
- 546 W Mckibben St
- 745 Richie Ave
- 543 N Metcalf St