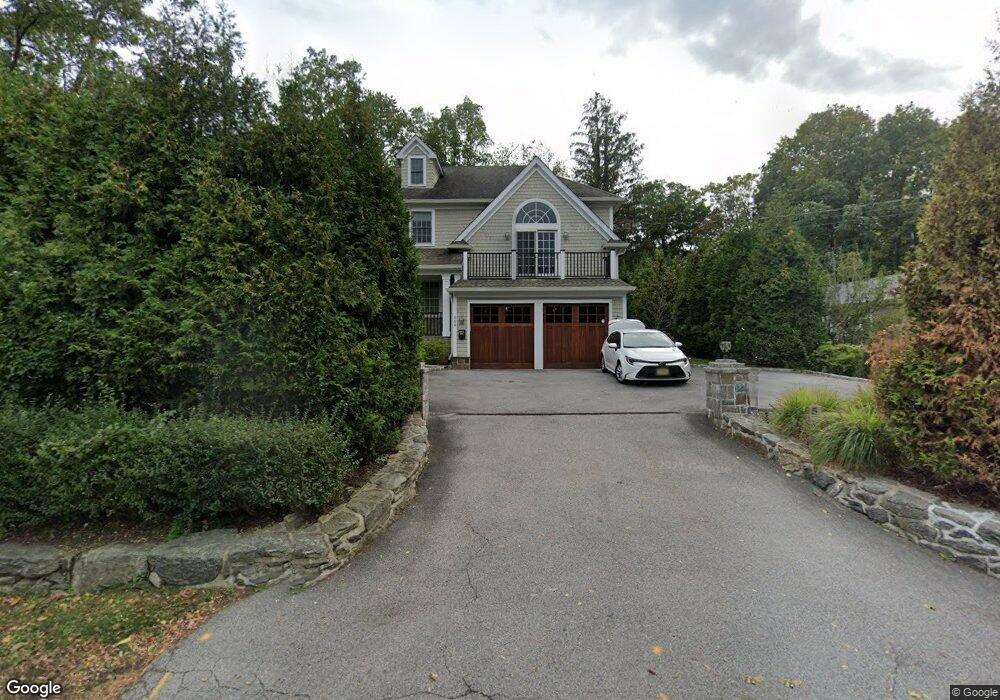
539 Weaver St Larchmont, NY 10538
Estimated Value: $2,155,000 - $2,570,672
5
Beds
5
Baths
4,360
Sq Ft
$524/Sq Ft
Est. Value
About This Home
This home is located at 539 Weaver St, Larchmont, NY 10538 and is currently estimated at $2,283,168, approximately $523 per square foot. 539 Weaver St is a home located in Westchester County with nearby schools including Mamaroneck High School, Sts. John & Paul School, and Hudson Country Montessori School.
Ownership History
Date
Name
Owned For
Owner Type
Purchase Details
Closed on
Sep 8, 2023
Sold by
538 Weaver Street Realty Llc
Bought by
Mundt Trevor and Mundt Kathryn
Current Estimated Value
Home Financials for this Owner
Home Financials are based on the most recent Mortgage that was taken out on this home.
Original Mortgage
$750,000
Outstanding Balance
$731,012
Interest Rate
6%
Mortgage Type
New Conventional
Estimated Equity
$1,552,156
Purchase Details
Closed on
Dec 5, 2011
Sold by
Holst Robert H
Bought by
538 Weaver Street Realty Llc
Create a Home Valuation Report for This Property
The Home Valuation Report is an in-depth analysis detailing your home's value as well as a comparison with similar homes in the area
Home Values in the Area
Average Home Value in this Area
Purchase History
| Date | Buyer | Sale Price | Title Company |
|---|---|---|---|
| Mundt Trevor | $1,800,000 | Thoroughbred Title | |
| 538 Weaver Street Realty Llc | $500,000 | Castle Title Ins Agency Inc |
Source: Public Records
Mortgage History
| Date | Status | Borrower | Loan Amount |
|---|---|---|---|
| Open | Mundt Trevor | $750,000 |
Source: Public Records
Tax History Compared to Growth
Tax History
| Year | Tax Paid | Tax Assessment Tax Assessment Total Assessment is a certain percentage of the fair market value that is determined by local assessors to be the total taxable value of land and additions on the property. | Land | Improvement |
|---|---|---|---|---|
| 2024 | $40,984 | $1,800,000 | $535,000 | $1,265,000 |
| 2023 | $45,880 | $1,995,000 | $535,000 | $1,460,000 |
| 2022 | $46,701 | $2,147,000 | $535,000 | $1,612,000 |
| 2021 | $45,973 | $2,007,000 | $535,000 | $1,472,000 |
| 2020 | $45,351 | $1,949,000 | $535,000 | $1,414,000 |
| 2019 | $44,826 | $1,949,000 | $535,000 | $1,414,000 |
| 2018 | $35,804 | $1,949,000 | $535,000 | $1,414,000 |
| 2017 | $0 | $1,949,000 | $535,000 | $1,414,000 |
| 2016 | $48,295 | $1,949,000 | $299,500 | $1,649,500 |
| 2015 | -- | $2,350,000 | $299,500 | $2,050,500 |
| 2014 | -- | $2,180,000 | $299,500 | $1,880,500 |
| 2013 | -- | $2,180,000 | $299,500 | $1,880,500 |
Source: Public Records
Map
Nearby Homes