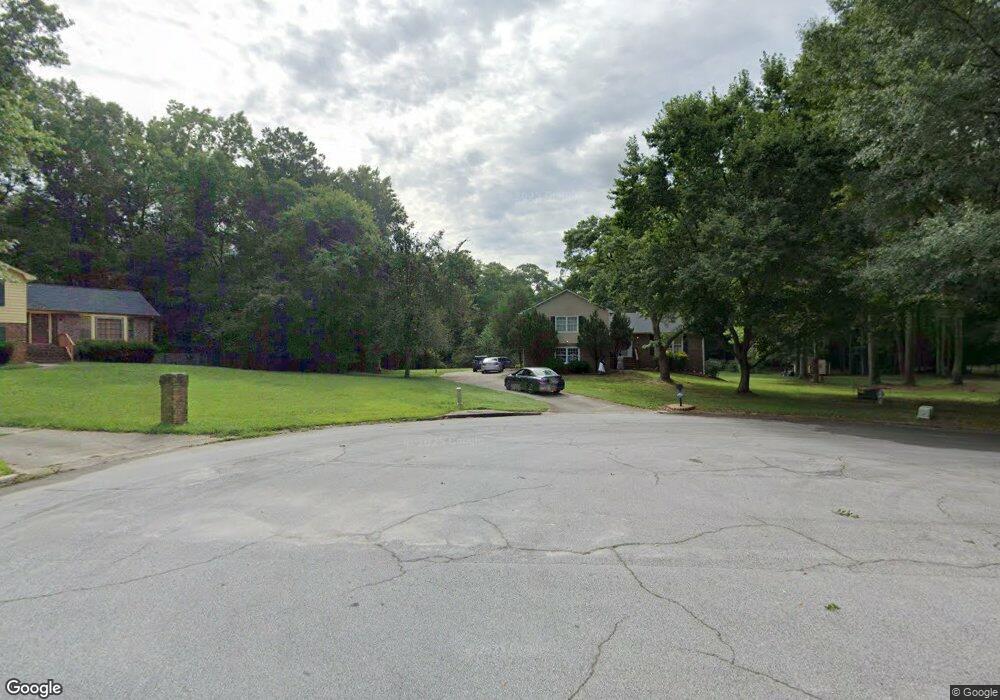
539 Westbridge Dr Unit 539 Fayetteville, GA 30214
Estimated Value: $337,000 - $389,162
--
Bed
1
Bath
2,415
Sq Ft
$150/Sq Ft
Est. Value
About This Home
This home is located at 539 Westbridge Dr Unit 539, Fayetteville, GA 30214 and is currently estimated at $362,041, approximately $149 per square foot. 539 Westbridge Dr Unit 539 is a home located in Fayette County with nearby schools including North Fayette Elementary School, Flat Rock Middle School, and Sandy Creek High School.
Ownership History
Date
Name
Owned For
Owner Type
Purchase Details
Closed on
Dec 16, 2016
Sold by
Federal Natl Mtg Assn
Bought by
Allen Janeen
Current Estimated Value
Home Financials for this Owner
Home Financials are based on the most recent Mortgage that was taken out on this home.
Original Mortgage
$155,138
Outstanding Balance
$128,553
Interest Rate
4.4%
Mortgage Type
FHA
Estimated Equity
$233,488
Purchase Details
Closed on
Jan 26, 2016
Sold by
Ditech Financial Llc
Bought by
Federal National Mortgage Association
Purchase Details
Closed on
Dec 1, 2015
Sold by
Thomas Amelia
Bought by
Ditech Financial Llc
Purchase Details
Closed on
Jan 7, 2005
Sold by
Toppin Ian and Toppin Sheila
Bought by
Thomas Amelia
Home Financials for this Owner
Home Financials are based on the most recent Mortgage that was taken out on this home.
Original Mortgage
$175,000
Interest Rate
5.63%
Mortgage Type
New Conventional
Purchase Details
Closed on
Aug 26, 1994
Sold by
Maloney John F and Maloney Donna J
Bought by
Toppin Ian and Toppin Sheila
Home Financials for this Owner
Home Financials are based on the most recent Mortgage that was taken out on this home.
Original Mortgage
$114,162
Interest Rate
8.74%
Mortgage Type
FHA
Create a Home Valuation Report for This Property
The Home Valuation Report is an in-depth analysis detailing your home's value as well as a comparison with similar homes in the area
Home Values in the Area
Average Home Value in this Area
Purchase History
| Date | Buyer | Sale Price | Title Company |
|---|---|---|---|
| Allen Janeen | $158,000 | -- | |
| Federal National Mortgage Association | $79,300 | -- | |
| Ditech Financial Llc | $79,300 | -- | |
| Thomas Amelia | $175,000 | -- | |
| Toppin Ian | $117,000 | -- |
Source: Public Records
Mortgage History
| Date | Status | Borrower | Loan Amount |
|---|---|---|---|
| Open | Allen Janeen | $155,138 | |
| Previous Owner | Thomas Amelia | $175,000 | |
| Previous Owner | Toppin Ian | $114,162 |
Source: Public Records
Tax History Compared to Growth
Tax History
| Year | Tax Paid | Tax Assessment Tax Assessment Total Assessment is a certain percentage of the fair market value that is determined by local assessors to be the total taxable value of land and additions on the property. | Land | Improvement |
|---|---|---|---|---|
| 2024 | $2,679 | $160,616 | $24,000 | $136,616 |
| 2023 | $2,127 | $133,360 | $24,000 | $109,360 |
| 2022 | $2,456 | $127,760 | $24,000 | $103,760 |
| 2021 | $2,300 | $110,280 | $24,000 | $86,280 |
| 2020 | $2,578 | $91,840 | $11,200 | $80,640 |
| 2019 | $2,049 | $72,400 | $11,200 | $61,200 |
| 2018 | $1,958 | $68,480 | $11,200 | $57,280 |
| 2017 | $1,894 | $66,000 | $11,200 | $54,800 |
| 2016 | $1,718 | $55,920 | $11,200 | $44,720 |
| 2015 | $1,626 | $51,880 | $11,200 | $40,680 |
| 2014 | $1,493 | $46,800 | $11,200 | $35,600 |
| 2013 | -- | $47,160 | $0 | $0 |
Source: Public Records
Map
Nearby Homes
- 535 Westbridge Dr
- 849 Wagon Wheel Cir
- 919 Kite Lake Trail
- 405 Fairfield Cir
- 165 Standing Oak Place
- 150 Gadson Dr
- 105 Benson Cir
- 2725 Old Jonesboro Rd
- 120 Morning Springs Walk
- 280 Benjamin Cir
- 215 Gadson Dr
- 215 Dix Lee On Dr
- 235 Gadson Dr
- 285 Dix Lee On Dr
- 245 Gadson Dr
- 130 Benjamin Cir
- 3503 Ebb Cir
- 7637 Rudder Cir
- 0 Dix Lee On Dr Unit 10607582
- 2655 West Rd
- 539 Westbridge Dr
- 541 Covered Bridge Trail
- 0 Covered Bridge Trail Unit 8788683
- 0 Covered Bridge Trail Unit 8787910
- 0 Covered Bridge Trail Unit 8455788
- 0 Covered Bridge Trail Unit 8062933
- 0 Covered Bridge Trail Unit 8603582
- 0 Covered Bridge Trail Unit 7328862
- 0 Covered Bridge Trail Unit 8014587
- 0 Covered Bridge Trail
- 537 Westbridge Dr
- 543 Covered Bridge Trail
- 533 Westbridge Dr
- 545 Covered Bridge Trail
- 530 Covered Bridge Trail
- 547 Covered Bridge Trail
- 532 Covered Bridge Trail
- 531 Westbridge Dr Unit 1
- 528 Westbridge Dr
- 534 Covered Bridge Trail