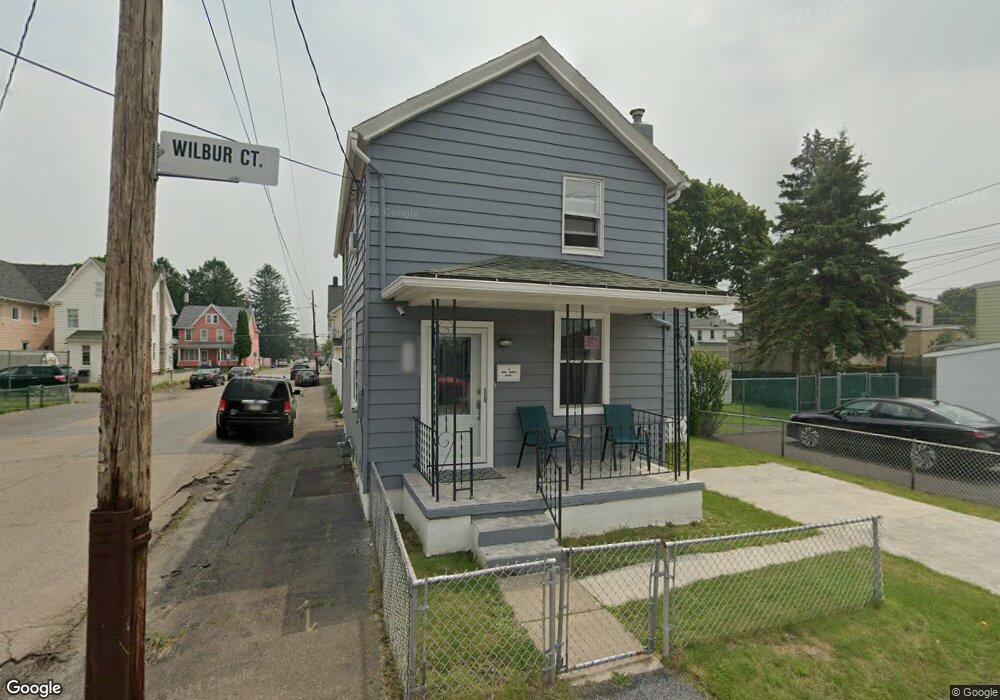
539 Wilbur Ct Hazleton, PA 18201
Estimated Value: $104,000 - $165,000
3
Beds
1
Bath
1,212
Sq Ft
$108/Sq Ft
Est. Value
About This Home
This home is located at 539 Wilbur Ct, Hazleton, PA 18201 and is currently estimated at $131,253, approximately $108 per square foot. 539 Wilbur Ct is a home located in Luzerne County with nearby schools including Hazleton Area High School, Immanuel Christian School, and Holy Family Academy.
Ownership History
Date
Name
Owned For
Owner Type
Purchase Details
Closed on
Dec 22, 2017
Sold by
Williams Nancy and Estate Of Teresa Jeanne Willia
Bought by
Espinal Gloria G Perez
Current Estimated Value
Home Financials for this Owner
Home Financials are based on the most recent Mortgage that was taken out on this home.
Original Mortgage
$61,013
Outstanding Balance
$50,733
Interest Rate
3.92%
Mortgage Type
New Conventional
Estimated Equity
$80,520
Purchase Details
Closed on
Jan 1, 1960
Bought by
Williams Sterling and Williams Theresa
Create a Home Valuation Report for This Property
The Home Valuation Report is an in-depth analysis detailing your home's value as well as a comparison with similar homes in the area
Home Values in the Area
Average Home Value in this Area
Purchase History
| Date | Buyer | Sale Price | Title Company |
|---|---|---|---|
| Espinal Gloria G Perez | $62,900 | Covenant Abstract | |
| Williams Sterling | -- | -- |
Source: Public Records
Mortgage History
| Date | Status | Borrower | Loan Amount |
|---|---|---|---|
| Open | Espinal Gloria G Perez | $61,013 |
Source: Public Records
Tax History
| Year | Tax Paid | Tax Assessment Tax Assessment Total Assessment is a certain percentage of the fair market value that is determined by local assessors to be the total taxable value of land and additions on the property. | Land | Improvement |
|---|---|---|---|---|
| 2026 | $897 | $43,700 | $20,600 | $23,100 |
| 2025 | $1,255 | $43,700 | $20,600 | $23,100 |
| 2024 | $1,176 | $43,700 | $20,600 | $23,100 |
| 2023 | $1,099 | $43,700 | $20,600 | $23,100 |
| 2022 | $1,091 | $43,700 | $20,600 | $23,100 |
| 2021 | $1,066 | $43,700 | $20,600 | $23,100 |
| 2020 | $953 | $43,700 | $20,600 | $23,100 |
| 2019 | $983 | $43,700 | $20,600 | $23,100 |
| 2018 | $949 | $43,700 | $20,600 | $23,100 |
| 2017 | $875 | $43,700 | $20,600 | $23,100 |
| 2016 | $237 | $43,700 | $20,600 | $23,100 |
| 2015 | $204 | $43,700 | $20,600 | $23,100 |
| 2014 | $204 | $43,700 | $20,600 | $23,100 |
Source: Public Records
Map
Nearby Homes
- 1 W Diamond Ave
- 118 E Green St
- 360 W Spruce St
- 403 W 7th St
- 60 E Jefferson Ave
- 714 Alter St
- 116 N Laurel St
- 187 N Church St
- 52 N Laurel St
- 127 W Diamond Ave
- 239 Lincalis St
- 218 North St
- ER.126 W Aspen St
- 14 W 4th St
- 101 S Wyoming St
- Lot 46 Mountain Laurel Dr
- 1311 &1315 Hazlebrook Rd
- 14 Nicole Ln
- 328 W Green St
- 845 N Vine St
Your Personal Tour Guide
Ask me questions while you tour the home.