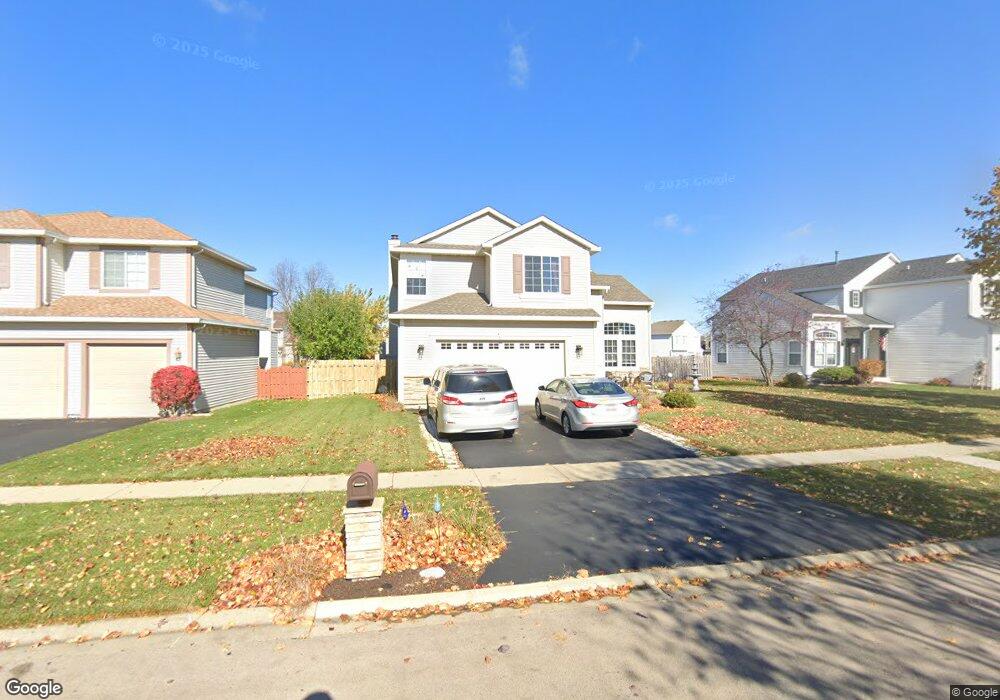
5391 Sullivan Pass Lake In the Hills, IL 60156
Estimated Value: $385,246 - $465,000
5
Beds
--
Bath
2,588
Sq Ft
$168/Sq Ft
Est. Value
About This Home
This home is located at 5391 Sullivan Pass, Lake In the Hills, IL 60156 and is currently estimated at $434,062, approximately $167 per square foot. 5391 Sullivan Pass is a home located in McHenry County with nearby schools including Martin Elementary School, Chesak Elementary School, and Marlowe Middle School.
Ownership History
Date
Name
Owned For
Owner Type
Purchase Details
Closed on
Sep 16, 2005
Sold by
Wightman Robert E and Wightman Leona L
Bought by
Romero Leonel and Romero Maria I
Current Estimated Value
Home Financials for this Owner
Home Financials are based on the most recent Mortgage that was taken out on this home.
Original Mortgage
$99,000
Interest Rate
6.2%
Mortgage Type
New Conventional
Purchase Details
Closed on
Dec 19, 1997
Sold by
Pinnacle Corp
Bought by
Wightman Robert E and Wightman Leona L
Home Financials for this Owner
Home Financials are based on the most recent Mortgage that was taken out on this home.
Original Mortgage
$189,900
Interest Rate
7.35%
Mortgage Type
Balloon
Create a Home Valuation Report for This Property
The Home Valuation Report is an in-depth analysis detailing your home's value as well as a comparison with similar homes in the area
Home Values in the Area
Average Home Value in this Area
Purchase History
| Date | Buyer | Sale Price | Title Company |
|---|---|---|---|
| Romero Leonel | $324,000 | Burnet Title Llc | |
| Wightman Robert E | $208,500 | Chicago Title |
Source: Public Records
Mortgage History
| Date | Status | Borrower | Loan Amount |
|---|---|---|---|
| Previous Owner | Romero Leonel | $99,000 | |
| Previous Owner | Wightman Robert E | $189,900 |
Source: Public Records
Tax History Compared to Growth
Tax History
| Year | Tax Paid | Tax Assessment Tax Assessment Total Assessment is a certain percentage of the fair market value that is determined by local assessors to be the total taxable value of land and additions on the property. | Land | Improvement |
|---|---|---|---|---|
| 2024 | $8,227 | $119,588 | $6,989 | $112,599 |
| 2023 | $8,008 | $107,427 | $6,278 | $101,149 |
| 2022 | $7,690 | $97,821 | $5,717 | $92,104 |
| 2021 | $7,449 | $92,127 | $5,384 | $86,743 |
| 2020 | $7,346 | $89,670 | $5,240 | $84,430 |
| 2019 | $7,167 | $87,380 | $5,106 | $82,274 |
| 2018 | $6,578 | $79,187 | $5,747 | $73,440 |
| 2017 | $6,448 | $74,627 | $5,416 | $69,211 |
| 2016 | $6,503 | $70,951 | $5,149 | $65,802 |
| 2013 | -- | $70,887 | $13,316 | $57,571 |
Source: Public Records
Map
Nearby Homes
- 390 Windermere Way
- 870 Noelle Bend
- 131 S Annandale Dr
- 10117 Dunhill Dr
- 4535 Heron Dr
- 9105 Algonquin Rd
- 8 Litchfield Ct Unit 1
- 6 Sugar Maple Ct
- 10828 Braemar Pkwy
- 2390 Wexford Ln
- 9103 Miller Rd Unit 2
- 9103 Miller Rd Unit 3
- 9103 Miller Rd Unit 4
- 9103 Miller Rd Unit 1
- 9103 Miller Rd Unit 5
- 10549 Wakefield Ln
- 10540 Wakefield Ln Unit 11
- 10967 Braemar Pkwy
- 11290 Wildridge Ln
- 775 White Pine Cir
- 5401 Sullivan Pass
- 5381 Sullivan Pass
- 5380 Chancery Way
- 5411 Sullivan Pass
- 5370 Chancery Way
- 5390 Chancery Way
- 5400 Sullivan Pass
- 5421 Sullivan Pass
- 5400 Chancery Way
- 5410 Sullivan Pass
- 5390 Sullivan Pass
- 5360 Chancery Way
- 5420 Sullivan Pass
- 5410 Chancery Way
- 5380 Sullivan Pass
- 5431 Sullivan Pass
- 281 Ellis Rd
- 5430 Sullivan Pass
- 5370 Sullivan Pass
- 5420 Chancery Way