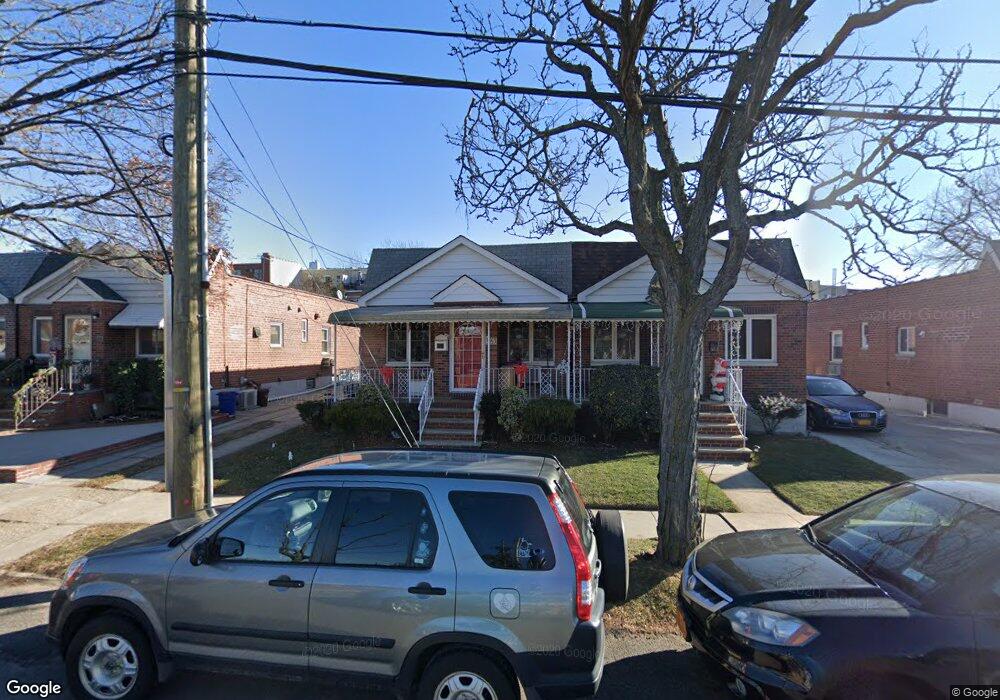
5393 62nd St Maspeth, NY 11378
Maspeth NeighborhoodEstimated Value: $760,916 - $789,000
Studio
--
Bath
840
Sq Ft
$927/Sq Ft
Est. Value
About This Home
This home is located at 5393 62nd St, Maspeth, NY 11378 and is currently estimated at $778,479, approximately $926 per square foot. 5393 62nd St is a home located in Queens County with nearby schools including P.S. 229 Emanuel Kaplan, IS 73 - The Frank Sansivieri School, and Grover Cleveland High School.
Ownership History
Date
Name
Owned For
Owner Type
Purchase Details
Closed on
Jul 22, 2008
Sold by
Crilley Melissa and Gleeson Melissa
Bought by
Gleeson Mark and Gleeson Melissa
Current Estimated Value
Purchase Details
Closed on
Dec 12, 2007
Sold by
Sosa Madeline
Bought by
Crilley Melissa
Home Financials for this Owner
Home Financials are based on the most recent Mortgage that was taken out on this home.
Original Mortgage
$470,250
Outstanding Balance
$294,482
Interest Rate
6.27%
Mortgage Type
Purchase Money Mortgage
Estimated Equity
$483,997
Purchase Details
Closed on
Aug 6, 2007
Sold by
Lasis Peggy Ann and Morgello Peggy Ann
Bought by
Sosa Madeline
Purchase Details
Closed on
Jan 8, 1998
Sold by
Sarmuksnis Helen
Bought by
Lasis Peggy Ann
Create a Home Valuation Report for This Property
The Home Valuation Report is an in-depth analysis detailing your home's value as well as a comparison with similar homes in the area
Home Values in the Area
Average Home Value in this Area
Purchase History
| Date | Buyer | Sale Price | Title Company |
|---|---|---|---|
| Gleeson Mark | -- | -- | |
| Gleeson Mark | -- | -- | |
| Crilley Melissa | $495,000 | -- | |
| Crilley Melissa | $495,000 | -- | |
| Sosa Madeline | $510,000 | -- | |
| Sosa Madeline | $510,000 | -- | |
| Lasis Peggy Ann | -- | -- | |
| Lasis Peggy Ann | -- | -- |
Source: Public Records
Mortgage History
| Date | Status | Borrower | Loan Amount |
|---|---|---|---|
| Open | Crilley Melissa | $470,250 | |
| Closed | Crilley Melissa | $470,250 |
Source: Public Records
Tax History
| Year | Tax Paid | Tax Assessment Tax Assessment Total Assessment is a certain percentage of the fair market value that is determined by local assessors to be the total taxable value of land and additions on the property. | Land | Improvement |
|---|---|---|---|---|
| 2025 | $7,597 | $40,031 | $9,551 | $30,480 |
| 2024 | $7,597 | $37,822 | $9,253 | $28,569 |
| 2023 | $7,597 | $37,822 | $9,204 | $28,618 |
| 2022 | $7,130 | $42,540 | $10,980 | $31,560 |
| 2021 | $7,091 | $39,840 | $10,980 | $28,860 |
| 2020 | $7,061 | $38,760 | $10,980 | $27,780 |
| 2019 | $6,593 | $33,180 | $10,980 | $22,200 |
| 2018 | $6,425 | $31,518 | $8,915 | $22,603 |
| 2017 | $6,067 | $29,764 | $9,440 | $20,324 |
| 2016 | $5,613 | $29,764 | $9,440 | $20,324 |
| 2015 | $3,167 | $27,799 | $10,431 | $17,368 |
| 2014 | $3,167 | $26,265 | $11,718 | $14,547 |
Source: Public Records
Map
Nearby Homes
- 53-26 61st St
- 5351 63rd St
- 5337 62nd St
- 5428 65th Place
- 6040 55th Dr
- 53-54 66th St
- 62-15 53rd Ave Unit LGD
- 53-36 66th St
- 53-24 66th St
- 5307 65th Place
- 61-54 56th Ave
- 52-60 65th Place Unit 5E
- 53-36 67th St
- 52-24 65th Place Unit 3K
- 66-17 Clinton Ave
- 6619 Clinton Ave
- 52-61 66th St
- 6511 Perry Ave
- 61-22 56th Dr
- 61-18 56th Dr
Your Personal Tour Guide
Ask me questions while you tour the home.