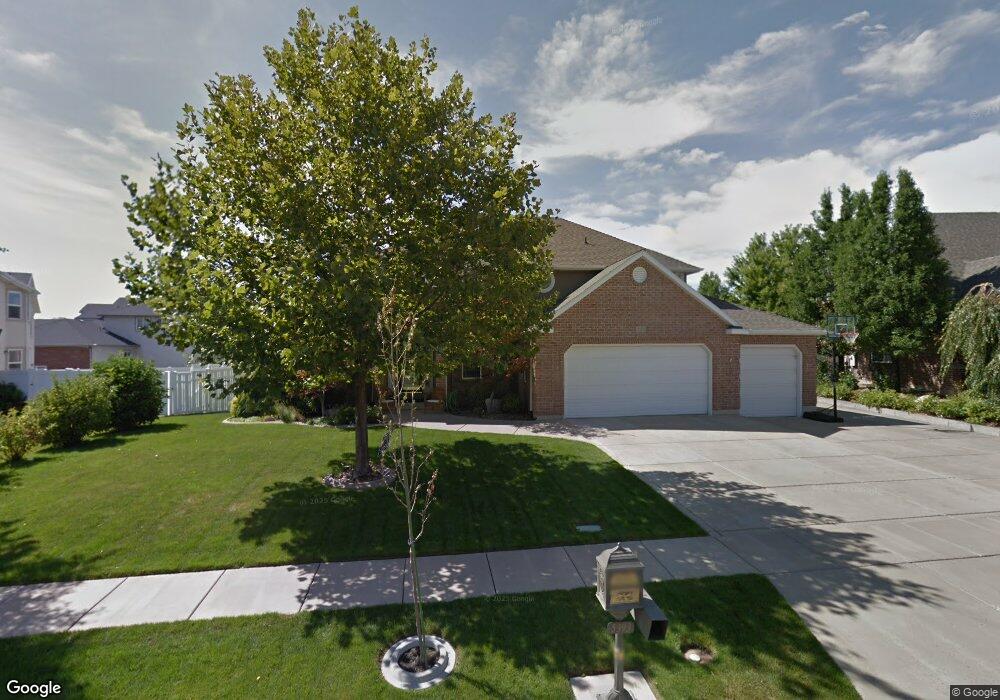
5393 Tomahawk Ln Ogden, UT 84403
Southeast Ogden NeighborhoodEstimated Value: $780,914 - $873,000
6
Beds
4
Baths
4,330
Sq Ft
$190/Sq Ft
Est. Value
About This Home
This home is located at 5393 Tomahawk Ln, Ogden, UT 84403 and is currently estimated at $820,729, approximately $189 per square foot. 5393 Tomahawk Ln is a home located in Weber County with nearby schools including Shadow Valley School, Mount Ogden Junior High School, and Ogden High School.
Ownership History
Date
Name
Owned For
Owner Type
Purchase Details
Closed on
May 24, 2000
Sold by
Connor Michael J and Connor Kate N
Bought by
Campbell Stewart J
Current Estimated Value
Home Financials for this Owner
Home Financials are based on the most recent Mortgage that was taken out on this home.
Original Mortgage
$250,000
Interest Rate
7.06%
Mortgage Type
Purchase Money Mortgage
Purchase Details
Closed on
Mar 17, 1998
Sold by
Kirk Darrell G and Kirk Linda
Bought by
Connor Michael J
Home Financials for this Owner
Home Financials are based on the most recent Mortgage that was taken out on this home.
Original Mortgage
$310,650
Interest Rate
7.02%
Mortgage Type
Purchase Money Mortgage
Purchase Details
Closed on
May 1, 1997
Sold by
Kirk Darrell G
Bought by
Kirk Darrell G
Purchase Details
Closed on
Apr 18, 1997
Sold by
Nwc Inc
Bought by
Kirk Darrell G and Kirk Building & Development
Create a Home Valuation Report for This Property
The Home Valuation Report is an in-depth analysis detailing your home's value as well as a comparison with similar homes in the area
Home Values in the Area
Average Home Value in this Area
Purchase History
| Date | Buyer | Sale Price | Title Company |
|---|---|---|---|
| Campbell Stewart J | -- | Associated Title | |
| Connor Michael J | -- | Associated Title | |
| Kirk Darrell G | -- | First American Title | |
| Kirk Darrell G | -- | Founders Title |
Source: Public Records
Mortgage History
| Date | Status | Borrower | Loan Amount |
|---|---|---|---|
| Previous Owner | Campbell Stewart J | $250,000 | |
| Previous Owner | Connor Michael J | $310,650 | |
| Closed | Campbell Stewart J | $31,250 |
Source: Public Records
Tax History
| Year | Tax Paid | Tax Assessment Tax Assessment Total Assessment is a certain percentage of the fair market value that is determined by local assessors to be the total taxable value of land and additions on the property. | Land | Improvement |
|---|---|---|---|---|
| 2025 | $4,993 | $380,999 | $126,012 | $254,987 |
| 2024 | $5,214 | $394,349 | $126,012 | $268,337 |
| 2023 | $5,204 | $398,750 | $126,012 | $272,738 |
| 2022 | $5,309 | $409,200 | $109,661 | $299,539 |
| 2021 | $4,574 | $583,000 | $124,783 | $458,217 |
| 2020 | $4,266 | $502,000 | $99,805 | $402,195 |
| 2019 | $4,088 | $453,000 | $99,805 | $353,195 |
| 2018 | $3,831 | $422,000 | $99,805 | $322,195 |
| 2017 | $4,001 | $451,000 | $96,845 | $354,155 |
| 2016 | $3,870 | $218,073 | $49,562 | $168,511 |
| 2015 | $3,789 | $209,079 | $49,562 | $159,517 |
| 2014 | $3,541 | $192,427 | $46,773 | $145,654 |
Source: Public Records
Map
Nearby Homes
- 1880 Shadow Valley Dr
- 1963 Cherokee Cir
- 5341 Fillmore Ave
- 5304 S Skyline Pkwy
- 5538 Elderberry Ct
- 1929 E 5625 S
- 5600 Meadow Ln Unit 193
- 5630 Meadow Ln Unit 172
- 1842 E 5625 S Unit C
- 5660 S Meadow Ln Unit 156
- 5660 S Meadow Ln Unit 140
- 1762 Whispering Oaks Dr
- 5210 Skyline Pkwy
- 5053 Cheyenne Cir
- 5155 Mile High Cir
- 5780 Village Way
- 4983 Quail Ln
- 1805 E 5750 S
- 5028 S Ridgedale Dr
- 1860 Wasatch Dr
- 5371 Tomahawk Ln
- 1836 Shoshone Dr
- 1824 Shoshone Dr
- 5366 Shoshone Cir
- 5372 Shoshone Cir
- 5380 Tomahawk Ln
- 1847 Choctaw Ridge
- 1860 Shoshone Dr
- 1810 Shoshone Dr
- 1863 Shoshone Dr Unit 14
- 1865 Choctaw Ridge
- 1835 Choctaw Ridge
- 1831 Shoshone Dr
- 1851 Shoshone Dr
- 1886 Shoshone Dr
- 1886 Shoshone Dr
- 1798 Shoshone Dr
- 5361 Shoshone Cir
- 1817 Shoshone Dr
- 5382 Shoshone Cir
Your Personal Tour Guide
Ask me questions while you tour the home.