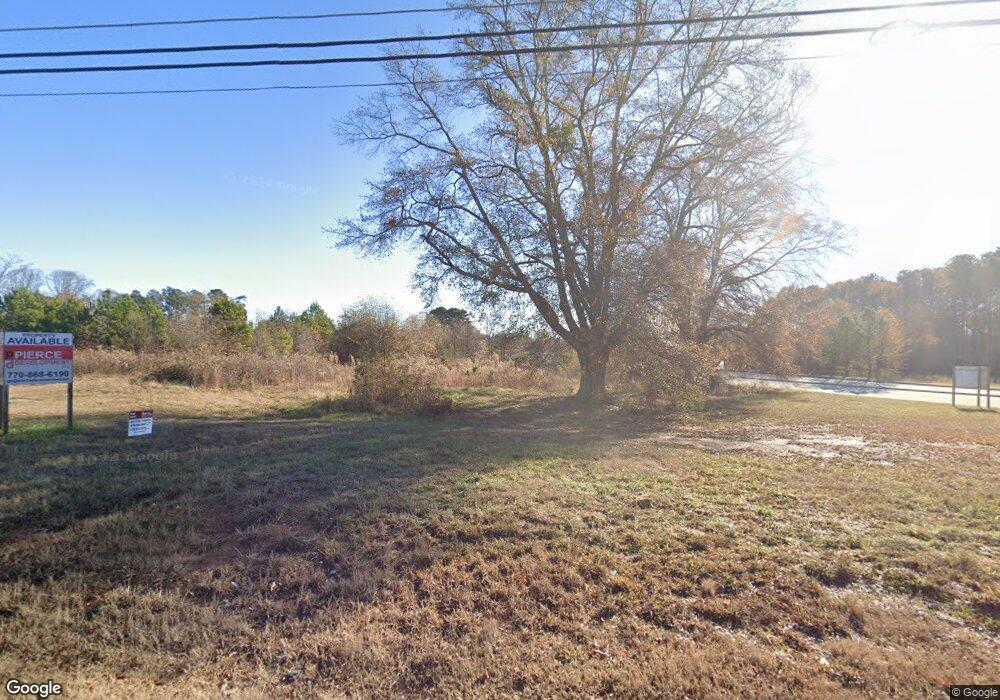
5394 Highway 53 Braselton, GA 30517
Estimated Value: $302,000 - $1,356,565
--
Bed
2
Baths
1,140
Sq Ft
$727/Sq Ft
Est. Value
About This Home
This home is located at 5394 Highway 53, Braselton, GA 30517 and is currently estimated at $829,283, approximately $727 per square foot. 5394 Highway 53 is a home located in Jackson County with nearby schools including West Jackson Elementary School, West Jackson Middle School, and Jackson County High School.
Ownership History
Date
Name
Owned For
Owner Type
Purchase Details
Closed on
Oct 26, 2018
Sold by
Flanigan Geoge P
Bought by
Jackson County 3 5 Llc
Current Estimated Value
Home Financials for this Owner
Home Financials are based on the most recent Mortgage that was taken out on this home.
Original Mortgage
$725,000
Interest Rate
4.7%
Mortgage Type
New Conventional
Purchase Details
Closed on
Dec 4, 2009
Sold by
Morris Charles L
Bought by
Jackson County Board Of Commissioners
Purchase Details
Closed on
Dec 2, 2009
Sold by
Jackson County
Bought by
Marciano Shannon Maria
Purchase Details
Closed on
Aug 3, 2007
Sold by
Not Provided
Bought by
Jackson County Board Of Commis
Purchase Details
Closed on
Jun 22, 2001
Sold by
First National Bank Of Jackson County
Bought by
Carter Phil
Home Financials for this Owner
Home Financials are based on the most recent Mortgage that was taken out on this home.
Original Mortgage
$35,000
Interest Rate
7.17%
Mortgage Type
New Conventional
Create a Home Valuation Report for This Property
The Home Valuation Report is an in-depth analysis detailing your home's value as well as a comparison with similar homes in the area
Home Values in the Area
Average Home Value in this Area
Purchase History
| Date | Buyer | Sale Price | Title Company |
|---|---|---|---|
| Jackson County 3 5 Llc | -- | -- | |
| Jackson County Board Of Commissioners | -- | -- | |
| Marciano Shannon Maria | -- | -- | |
| Jackson County Board Of Commis | $325,000 | -- | |
| Carter Phil | -- | -- | |
| Carter Phil | $160,000 | -- |
Source: Public Records
Mortgage History
| Date | Status | Borrower | Loan Amount |
|---|---|---|---|
| Closed | Jackson County 3 5 Llc | $725,000 | |
| Previous Owner | Carter Phil | $35,000 |
Source: Public Records
Tax History Compared to Growth
Tax History
| Year | Tax Paid | Tax Assessment Tax Assessment Total Assessment is a certain percentage of the fair market value that is determined by local assessors to be the total taxable value of land and additions on the property. | Land | Improvement |
|---|---|---|---|---|
| 2024 | $12,199 | $430,560 | $389,680 | $40,880 |
| 2023 | $12,199 | $425,760 | $389,680 | $36,080 |
| 2022 | $11,326 | $353,440 | $324,720 | $28,720 |
| 2021 | $13,178 | $407,560 | $378,840 | $28,720 |
| 2020 | $14,127 | $401,720 | $378,840 | $22,880 |
| 2019 | $14,381 | $401,720 | $378,840 | $22,880 |
| 2018 | $14,472 | $400,640 | $378,840 | $21,800 |
| 2017 | $23,425 | $643,803 | $624,600 | $19,203 |
| 2016 | $23,425 | $643,803 | $624,600 | $19,203 |
| 2015 | -- | $643,803 | $624,600 | $19,203 |
| 2014 | -- | $200,295 | $181,800 | $18,495 |
| 2013 | -- | $110,295 | $91,800 | $18,495 |
Source: Public Records
Map
Nearby Homes
- 5455 Highway 53
- 297 Orchid St
- 331 Orchid St
- 73 Osprey Overlook Dr
- 125 Osprey Overlook Dr
- 1404 Braselton Village Pkwy
- 225 Hickory Grove Ln
- 264 Golden Eagle Pkwy
- 921 Blind Brook Cir
- 222 Hickory Grove Ln
- 411 Red Wood Ln
- 408 Red Wood Ln
- 156 Reisling Dr
- 39 Pecan Ct
- 370 Golden Eagle Pkwy
- 11 Creekside Commons Dr
- 0 Lewis Braselton Hwy Unit 10065064
- 5411 Highway 53
- 5391 Highway 53
- 5338 Highway 53
- 5272 Highway 53
- 5293 Highway 53
- 12510 Lewis Braselton Blvd
- 225 Pinecrest Ln
- 225 Pinecrest Ln
- 225 Pinecrest Ln
- 167 Pinecrest Ln
- 5257 Highway 53
- 85 Highway 53
- 145 Pinecrest Ln
- 5257 Georgia 53
- 129 Pinecrest Ln
- 117 Pinecrest Ln
- 85 Pinecrest Ln
- 2091 Kaden Way (72)
- 67 Pinecrest Ln