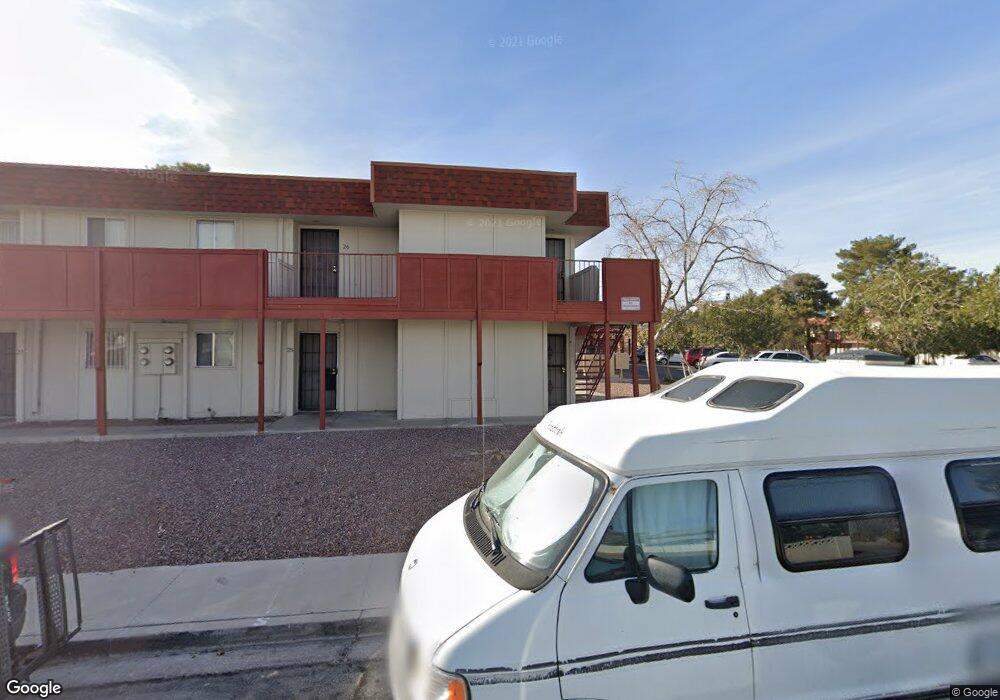
5394 Swenson St Unit 29 Las Vegas, NV 89119
University District NeighborhoodEstimated Value: $125,000 - $151,000
2
Beds
2
Baths
862
Sq Ft
$165/Sq Ft
Est. Value
About This Home
This home is located at 5394 Swenson St Unit 29, Las Vegas, NV 89119 and is currently estimated at $142,551, approximately $165 per square foot. 5394 Swenson St Unit 29 is a home located in Clark County with nearby schools including Gene Ward Elementary School, Jack Dailey Elementary School, and Helen C. Cannon Junior High School.
Ownership History
Date
Name
Owned For
Owner Type
Purchase Details
Closed on
Nov 21, 2024
Sold by
Brough David Taylor
Bought by
Mountain Vista Properties Llc
Current Estimated Value
Purchase Details
Closed on
Dec 18, 2007
Sold by
Preforeclosure Solutions Llc
Bought by
Brough David Taylor
Home Financials for this Owner
Home Financials are based on the most recent Mortgage that was taken out on this home.
Original Mortgage
$95,400
Interest Rate
6.15%
Mortgage Type
Purchase Money Mortgage
Purchase Details
Closed on
Jun 4, 2007
Sold by
Evans Shelley and Eschen Susan
Bought by
Perkins David and Perkins Linda K
Home Financials for this Owner
Home Financials are based on the most recent Mortgage that was taken out on this home.
Original Mortgage
$67,500
Interest Rate
6.14%
Mortgage Type
Purchase Money Mortgage
Purchase Details
Closed on
Aug 26, 1997
Sold by
Eschen Susan D
Bought by
Lehl Albert A
Purchase Details
Closed on
Jul 23, 1996
Sold by
Lehl Albert A
Bought by
Eschen Suasan D
Create a Home Valuation Report for This Property
The Home Valuation Report is an in-depth analysis detailing your home's value as well as a comparison with similar homes in the area
Home Values in the Area
Average Home Value in this Area
Purchase History
| Date | Buyer | Sale Price | Title Company |
|---|---|---|---|
| Mountain Vista Properties Llc | $86,000 | Landmark Title | |
| Brough David Taylor | $106,000 | Southwest Title | |
| Perkins David | $75,000 | Southwest Title | |
| Preforeclosure Solutions Llc | -- | Southwest Title | |
| Lehl Albert A | -- | -- | |
| Eschen Suasan D | -- | -- |
Source: Public Records
Mortgage History
| Date | Status | Borrower | Loan Amount |
|---|---|---|---|
| Previous Owner | Brough David Taylor | $95,400 | |
| Previous Owner | Perkins David | $67,500 |
Source: Public Records
Tax History Compared to Growth
Tax History
| Year | Tax Paid | Tax Assessment Tax Assessment Total Assessment is a certain percentage of the fair market value that is determined by local assessors to be the total taxable value of land and additions on the property. | Land | Improvement |
|---|---|---|---|---|
| 2025 | $449 | $21,229 | $12,600 | $8,629 |
| 2024 | $416 | $21,229 | $12,600 | $8,629 |
| 2023 | $277 | $22,488 | $14,000 | $8,488 |
| 2022 | $385 | $18,548 | $10,500 | $8,048 |
| 2021 | $357 | $18,145 | $10,150 | $7,995 |
| 2020 | $329 | $17,270 | $9,100 | $8,170 |
| 2019 | $308 | $16,665 | $8,400 | $8,265 |
| 2018 | $294 | $12,427 | $4,200 | $8,227 |
| 2017 | $375 | $12,781 | $4,200 | $8,581 |
| 2016 | $277 | $12,016 | $3,150 | $8,866 |
| 2015 | $275 | $10,363 | $1,750 | $8,613 |
| 2014 | -- | $8,801 | $1,750 | $7,051 |
Source: Public Records
Map
Nearby Homes
- 5404 Swenson St Unit 34
- 5390 Swenson St Unit 27
- 5384 Swenson St Unit 24
- 5422 Swenson St
- 5440 Swenson St Unit 18
- 5326 Swenson St Unit 61
- 5408 S Swenson St Unit 2
- 861 E Hacienda Ave
- 922 Westminster Ave
- 942 Westminster Ave
- 1037 Westminster Ave
- 944 de Met Dr
- 1077 Count Wutzke Ave
- 1108 Princess Katy Ave
- 5248 Greene Ln Unit B
- 5155 Gray Ln
- 5128 Wilbur St
- 5205 Golden Ln
- 5125 Gray Ln Unit B
- 5227 Garden Ln
- 5394 Swenson St
- 5386 Swenson St
- 5396 Swenson St
- 5390 Swenson St
- 5402 Swenson St
- 5388 Swenson St
- 5398 Swenson St
- 5404 Swenson St
- 5392 Swenson St
- 5402 Swenson St Unit 33
- 5392 Swenson St Unit 28
- 5388 Swenson St Unit 26
- 5396 Swenson St Unit 30
- 5400 Swenson St
- 5400 Swenson St Unit 32
- 5384 Swenson St Unit A
- 5382 Swenson St
- 5376 Swenson St
- 5374 Swenson St
- 5380 Swenson St