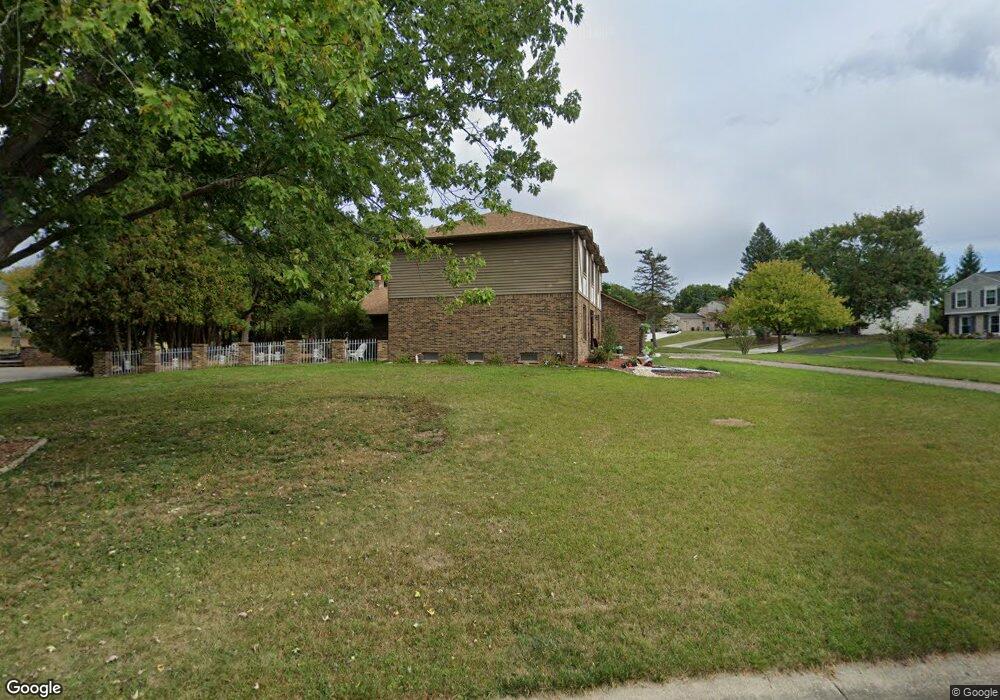
5395 Hollow Dr Bloomfield Hills, MI 48302
Estimated Value: $590,000 - $692,000
4
Beds
3
Baths
2,604
Sq Ft
$243/Sq Ft
Est. Value
About This Home
This home is located at 5395 Hollow Dr, Bloomfield Hills, MI 48302 and is currently estimated at $633,390, approximately $243 per square foot. 5395 Hollow Dr is a home located in Oakland County with nearby schools including Wylie E. Groves High School, West Maple Elementary School, and Berkshire Middle School.
Ownership History
Date
Name
Owned For
Owner Type
Purchase Details
Closed on
Dec 31, 2009
Sold by
Hollow Homes Llc and Steuer Brenda
Bought by
Sharaf Nadir and Sharaf Uzma
Current Estimated Value
Purchase Details
Closed on
Sep 12, 2006
Sold by
Ruby Carol
Bought by
Bank Of New York and Certificateholders Of Cwalt 2004-Cb
Purchase Details
Closed on
Jun 15, 2004
Sold by
Defilippis Christian and Defilippis Claudine
Bought by
Harlow Rothenberg Carol and Ruby Carol
Home Financials for this Owner
Home Financials are based on the most recent Mortgage that was taken out on this home.
Original Mortgage
$303,900
Interest Rate
6.37%
Mortgage Type
Purchase Money Mortgage
Create a Home Valuation Report for This Property
The Home Valuation Report is an in-depth analysis detailing your home's value as well as a comparison with similar homes in the area
Home Values in the Area
Average Home Value in this Area
Purchase History
| Date | Buyer | Sale Price | Title Company |
|---|---|---|---|
| Sharaf Nadir | $258,000 | None Available | |
| Bank Of New York | $311,132 | None Available | |
| Harlow Rothenberg Carol | $379,900 | Devon Title Agency |
Source: Public Records
Mortgage History
| Date | Status | Borrower | Loan Amount |
|---|---|---|---|
| Previous Owner | Harlow Rothenberg Carol | $303,900 |
Source: Public Records
Tax History Compared to Growth
Tax History
| Year | Tax Paid | Tax Assessment Tax Assessment Total Assessment is a certain percentage of the fair market value that is determined by local assessors to be the total taxable value of land and additions on the property. | Land | Improvement |
|---|---|---|---|---|
| 2024 | $3,414 | $260,730 | $0 | $0 |
| 2023 | $3,276 | $239,550 | $0 | $0 |
| 2022 | $5,546 | $203,730 | $0 | $0 |
| 2021 | $5,592 | $198,280 | $0 | $0 |
| 2020 | $3,147 | $208,960 | $0 | $0 |
| 2019 | $5,583 | $200,720 | $0 | $0 |
| 2018 | $5,541 | $189,080 | $0 | $0 |
| 2017 | $5,590 | $184,970 | $0 | $0 |
| 2016 | $5,567 | $181,390 | $0 | $0 |
| 2015 | -- | $158,300 | $0 | $0 |
| 2014 | -- | $135,950 | $0 | $0 |
| 2011 | -- | $121,490 | $0 | $0 |
Source: Public Records
Map
Nearby Homes
- 4783 Quarton Rd
- 5620 Inkster Rd
- 5620 Eastman Blvd
- 5118 Vincennes Ct
- 0000 Putnam Dr
- 5605 Woodwind Dr
- 2149 Sunnycrest Dr
- 4776 Walnut Lake Rd
- 5611 Priory Ln
- 1907 Raymond Place
- 4768 Wendrick Dr
- 5897 Sutters Ln
- 5881 Naneva Ct
- 4724 Tara Ct
- 4597 Broughton Dr
- 1651 Hoit Tower Dr
- 5190 Clarendon Crest St
- 1715 Lone Pine Rd
- 4603 Hedgewood Dr
- 5340 Franklin Rd
- 5407 Hollow Dr
- 5345 Hollow Dr
- 5360 Hollow Dr
- 5350 Hollow Dr
- 5400 Hollow Dr
- 5370 Hollow Dr
- 5335 Hollow Dr
- 5430 Vincennes Dr
- 5410 Hollow Dr
- 5380 Hollow Dr
- 5340 Hollow Dr
- 0000 Appoline Dr
- 0 Appoline Unit 4923912
- 5390 Vincennes Dr
- 5450 Vincennes Dr
- 5325 Hollow Dr
- 4876 Quarton Rd
- 4868 Quarton Rd
- 5330 Hollow Dr
- 4884 Quarton Rd