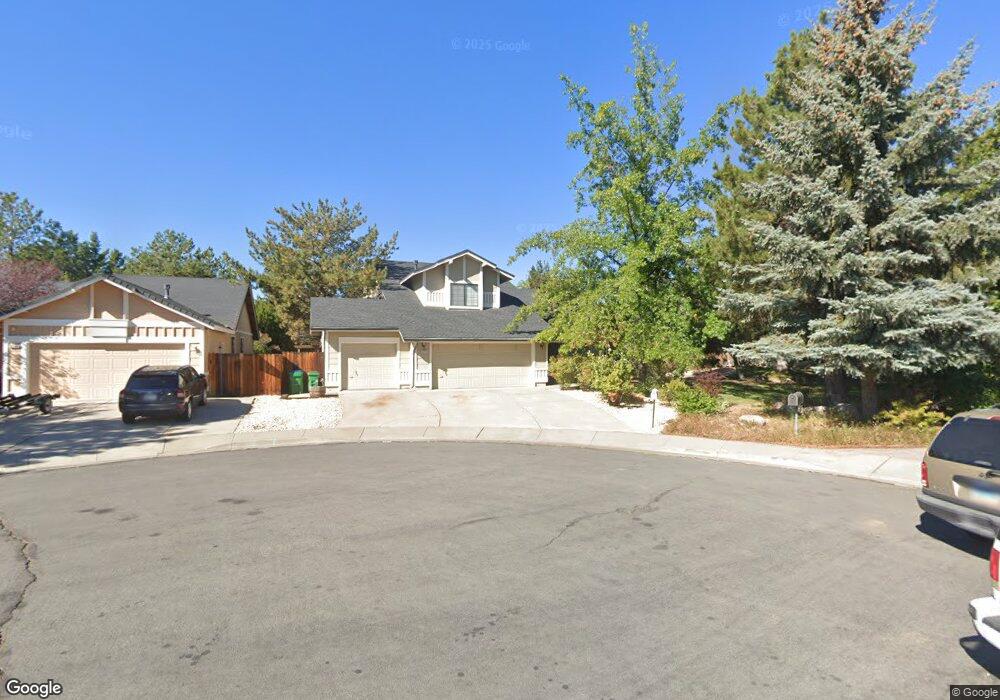
5395 Ladybug Ct Reno, NV 89523
Mae Anne Avenue NeighborhoodEstimated Value: $486,000 - $652,000
4
Beds
3
Baths
2,272
Sq Ft
$260/Sq Ft
Est. Value
About This Home
This home is located at 5395 Ladybug Ct, Reno, NV 89523 and is currently estimated at $591,343, approximately $260 per square foot. 5395 Ladybug Ct is a home located in Washoe County with nearby schools including Sarah Winnemucca Elementary School, B D Billinghurst Middle School, and Robert McQueen High School.
Ownership History
Date
Name
Owned For
Owner Type
Purchase Details
Closed on
Nov 27, 2001
Sold by
Nitcha Danilo Mendoza and Nitcha Maria Gelyn C
Bought by
Arif Mian M and Sodhi Kashmir S
Current Estimated Value
Purchase Details
Closed on
Jun 29, 2001
Sold by
Household Finance Realty Corp
Bought by
Arif Mian
Purchase Details
Closed on
Sep 22, 2000
Sold by
Eby Phillip E and Eby Deborah
Bought by
Household Finance Realty Corp Of Nevada
Purchase Details
Closed on
Dec 10, 1993
Sold by
Torres Phillip J and Torres Sandra A
Bought by
Eby Phillip E and Eby Deborah
Home Financials for this Owner
Home Financials are based on the most recent Mortgage that was taken out on this home.
Original Mortgage
$152,550
Interest Rate
6.89%
Create a Home Valuation Report for This Property
The Home Valuation Report is an in-depth analysis detailing your home's value as well as a comparison with similar homes in the area
Home Values in the Area
Average Home Value in this Area
Purchase History
| Date | Buyer | Sale Price | Title Company |
|---|---|---|---|
| Arif Mian M | $131,000 | -- | |
| Arif Mian | $131,000 | Stewart Title Northern Nevad | |
| Household Finance Realty Corp Of Nevada | $16,312 | First Centennial Title Co | |
| Eby Phillip E | $169,500 | First Centennial Title Co |
Source: Public Records
Mortgage History
| Date | Status | Borrower | Loan Amount |
|---|---|---|---|
| Previous Owner | Eby Phillip E | $152,550 |
Source: Public Records
Tax History
| Year | Tax Paid | Tax Assessment Tax Assessment Total Assessment is a certain percentage of the fair market value that is determined by local assessors to be the total taxable value of land and additions on the property. | Land | Improvement |
|---|---|---|---|---|
| 2026 | $2,062 | $92,850 | $39,478 | $53,372 |
| 2024 | $2,679 | $93,510 | $37,170 | $56,340 |
| 2023 | $2,601 | $93,421 | $39,470 | $53,951 |
| 2022 | $2,526 | $77,869 | $32,508 | $45,361 |
| 2021 | $2,453 | $67,855 | $22,208 | $45,647 |
| 2020 | $2,379 | $69,435 | $23,216 | $46,219 |
| 2019 | $2,297 | $67,033 | $21,231 | $45,802 |
| 2018 | $2,231 | $60,694 | $15,498 | $45,196 |
| 2017 | $2,168 | $60,104 | $14,459 | $45,645 |
| 2016 | $2,115 | $60,904 | $14,112 | $46,792 |
| 2015 | $2,109 | $59,512 | $12,317 | $47,195 |
| 2014 | $2,048 | $56,000 | $9,954 | $46,046 |
| 2013 | -- | $54,187 | $8,612 | $45,575 |
Source: Public Records
Map
Nearby Homes
- 5540 Daybreak Dr
- 5421 Daybreak Dr
- 5857 Morgan Horse St
- 5330 Windwood Ln
- 5861 Morgan Horse St
- 0 Simons Dr
- 5722 Golden Eagle Dr
- 5764 Golden Eagle Dr
- 1598 Grazer Way
- 2130 Canyon Mesa Ct
- 1596 Grazer Way
- 1820 Terrace Heights Ln
- 5833 Altitude St
- 2224 Escalera Way
- 5850 Blue Canyon Dr
- 1705 Sierra Highlands Dr
- 1927 Tuolumne Dr Unit 70
- 1473 Hogadon Way
- 5865 Mitra Way
- 1091 Crown View Dr
- 5399 Ladybug Ct
- 5391 Ladybug Ct
- 5385 Ladybug Ct Unit 3
- 5381 Ladybug Ct
- 1914 Rainbow Ridge Rd
- 1899 Rainbow Ridge Rd Unit 3
- 5398 Mountcrest Ln
- 1889 Rainbow Ridge Rd
- 1905 Rainbow Ridge Rd
- 5376 Mountcrest Ln
- 5391 Vista Larga Cir
- 5510 E Rainbow Ridge Ct
- 5381 Vista Larga Cir
- 5395 Vista Larga Cir
- 1879 Rainbow Ridge Rd
- 1915 Rainbow Ridge Rd
- 5370 Mountcrest Ln
- 1869 Rainbow Ridge Rd
- 5560 E Rainbow Ridge Ct
- 5395 Vista Ridge Way
Your Personal Tour Guide
Ask me questions while you tour the home.