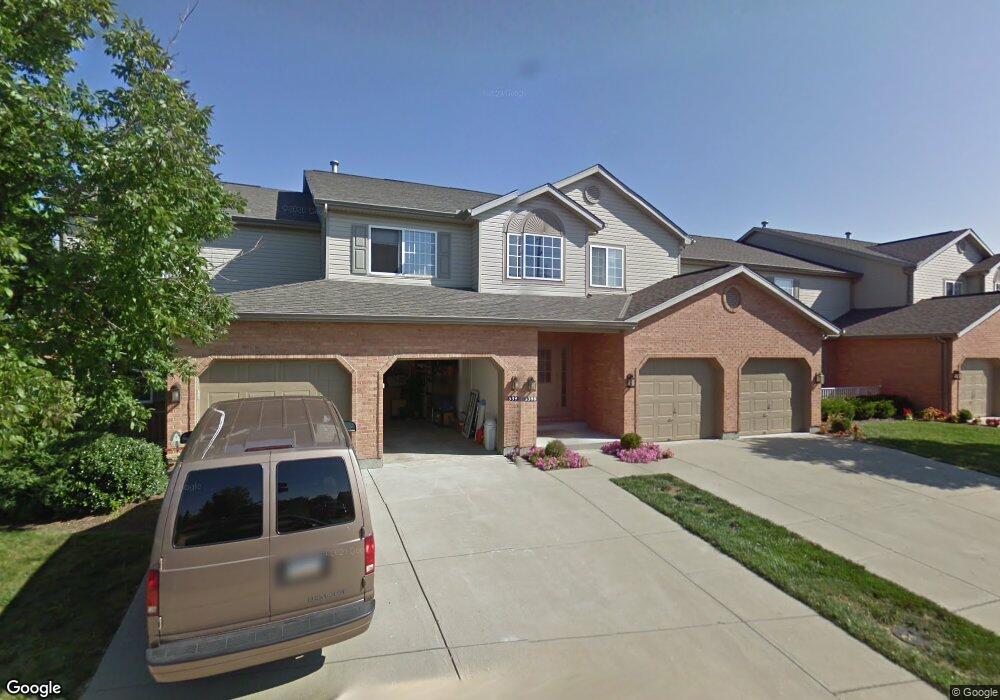
5398 Harbourwatch Way Unit 202 Mason, OH 45040
Deerfield Township NeighborhoodEstimated Value: $268,000 - $282,000
2
Beds
3
Baths
1,262
Sq Ft
$216/Sq Ft
Est. Value
About This Home
This home is located at 5398 Harbourwatch Way Unit 202, Mason, OH 45040 and is currently estimated at $272,521, approximately $215 per square foot. 5398 Harbourwatch Way Unit 202 is a home located in Warren County with nearby schools including Mason Intermediate Elementary School, Mason Middle School, and William Mason High School.
Ownership History
Date
Name
Owned For
Owner Type
Purchase Details
Closed on
Jul 21, 2022
Sold by
Ramsey Charles E and Ramsey Joan A
Bought by
Charles E And Joan A Ramsey Family Trust
Current Estimated Value
Purchase Details
Closed on
Feb 7, 2007
Sold by
Tipon William V
Bought by
Ramsey Charles E and Ramsey Joan A
Home Financials for this Owner
Home Financials are based on the most recent Mortgage that was taken out on this home.
Original Mortgage
$103,000
Interest Rate
6.27%
Mortgage Type
Purchase Money Mortgage
Purchase Details
Closed on
Nov 15, 1999
Sold by
Harbour Watch Llc
Bought by
Tipon William V
Home Financials for this Owner
Home Financials are based on the most recent Mortgage that was taken out on this home.
Original Mortgage
$98,250
Interest Rate
7.5%
Mortgage Type
New Conventional
Create a Home Valuation Report for This Property
The Home Valuation Report is an in-depth analysis detailing your home's value as well as a comparison with similar homes in the area
Home Values in the Area
Average Home Value in this Area
Purchase History
| Date | Buyer | Sale Price | Title Company |
|---|---|---|---|
| Charles E And Joan A Ramsey Family Trust | -- | None Listed On Document | |
| Ramsey Charles E | $135,000 | Acs Title & Closing Services | |
| Tipon William V | $122,900 | -- |
Source: Public Records
Mortgage History
| Date | Status | Borrower | Loan Amount |
|---|---|---|---|
| Previous Owner | Ramsey Charles E | $103,000 | |
| Previous Owner | Tipon William V | $98,250 |
Source: Public Records
Tax History Compared to Growth
Tax History
| Year | Tax Paid | Tax Assessment Tax Assessment Total Assessment is a certain percentage of the fair market value that is determined by local assessors to be the total taxable value of land and additions on the property. | Land | Improvement |
|---|---|---|---|---|
| 2024 | $3,257 | $76,570 | $21,000 | $55,570 |
| 2023 | $2,941 | $57,991 | $8,610 | $49,381 |
| 2022 | $2,941 | $57,992 | $8,610 | $49,382 |
| 2021 | $2,796 | $57,992 | $8,610 | $49,382 |
| 2020 | $2,677 | $47,149 | $7,000 | $40,149 |
| 2019 | $2,480 | $47,149 | $7,000 | $40,149 |
| 2018 | $2,490 | $47,149 | $7,000 | $40,149 |
| 2017 | $2,295 | $40,100 | $6,332 | $33,768 |
| 2016 | $2,360 | $40,100 | $6,332 | $33,768 |
| 2015 | $2,394 | $40,100 | $6,332 | $33,768 |
| 2014 | $2,394 | $37,480 | $5,920 | $31,560 |
| 2013 | $2,399 | $44,330 | $7,000 | $37,330 |
Source: Public Records
Map
Nearby Homes
- 5398 Harbourwatch Way
- 5626 Baywatch Way
- 5661 Baywatch Way
- 5339 Mapledale Way
- 8421 Cameron Ct
- 5369 N Shore Place
- 7693 Misty Springs Ct
- 7648 Waterfront Way
- 7660 Waterfront Way
- 7692 Waterfront Way
- 7600 Waterfront Way
- 7725 Livingston Dr
- 8659 Coveview Ct
- 5532 Winding Cape Way
- 7858 Yellowwood Dr
- 4765 Mallard Creek Dr
- 7911 Meadowbrook Dr
- 7839 Meadowbrook Dr
- 4447 Hyacinth Dr
- 7531 Kousa Ct
- 5398 Harbourwatch Way Unit 201
- 5398 Harbourwatch Way
- 5398 Harbourwatch Way
- 5398 Harbourwatch Way
- 5398 Harbourwatch Way
- 5398 Harbourwatch Way Unit 26102
- 5398 Harbourwatch Way Unit 26101
- 5398 Harbourwatch Way Unit 101
- 5398 Harbourwatch Way Unit 102
- 5398 Harbourwatch Way Unit 202
- 5398 Harbourwatch Way Unit 302
- 5398 Harbourwatch Way Unit 301
- 5408 Harbourwatch Way Unit 26303
- 5408 Harbourwatch Way
- 5408 Harbourwatch Way Unit 204
- 5408 Harbourwatch Way Unit 26304
- 5408 Harbourwatch Way Unit 26303
- 5408 Harbourwatch Way
- 5408 Harbourwatch Way
- 5408 Harbourwatch Way