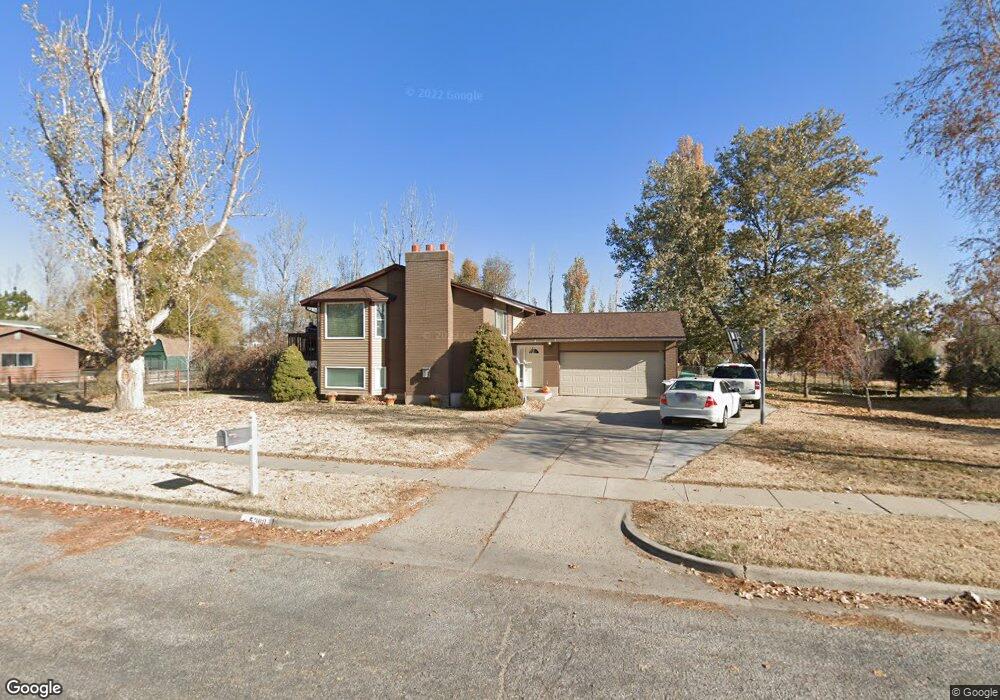
5398 S 5700 W Hooper, UT 84315
Estimated Value: $491,000 - $544,000
4
Beds
2
Baths
1,140
Sq Ft
$447/Sq Ft
Est. Value
About This Home
This home is located at 5398 S 5700 W, Hooper, UT 84315 and is currently estimated at $509,630, approximately $447 per square foot. 5398 S 5700 W is a home located in Weber County with nearby schools including Hooper Elementary School, Rocky Mountain Junior High School, and Fremont High School.
Ownership History
Date
Name
Owned For
Owner Type
Purchase Details
Closed on
Jul 12, 2024
Sold by
Freston Frankijo
Bought by
Banded Properties Llc
Current Estimated Value
Purchase Details
Closed on
Apr 21, 2000
Sold by
Freston David J
Bought by
Freston David J and Freston Frankijo
Home Financials for this Owner
Home Financials are based on the most recent Mortgage that was taken out on this home.
Original Mortgage
$142,500
Interest Rate
8.24%
Purchase Details
Closed on
Apr 19, 2000
Sold by
Daniels Barry N and Daniels Tiffany T
Bought by
Freston David J
Home Financials for this Owner
Home Financials are based on the most recent Mortgage that was taken out on this home.
Original Mortgage
$142,500
Interest Rate
8.24%
Create a Home Valuation Report for This Property
The Home Valuation Report is an in-depth analysis detailing your home's value as well as a comparison with similar homes in the area
Home Values in the Area
Average Home Value in this Area
Purchase History
| Date | Buyer | Sale Price | Title Company |
|---|---|---|---|
| Banded Properties Llc | -- | Real Advantage Title | |
| Freston David J | -- | Inwest Title | |
| Freston David J | -- | Inwest Title |
Source: Public Records
Mortgage History
| Date | Status | Borrower | Loan Amount |
|---|---|---|---|
| Previous Owner | Freston David J | $142,500 |
Source: Public Records
Tax History Compared to Growth
Tax History
| Year | Tax Paid | Tax Assessment Tax Assessment Total Assessment is a certain percentage of the fair market value that is determined by local assessors to be the total taxable value of land and additions on the property. | Land | Improvement |
|---|---|---|---|---|
| 2025 | $5,011 | $480,639 | $149,715 | $330,924 |
| 2024 | $2,652 | $471,000 | $149,715 | $321,285 |
| 2023 | $2,614 | $253,000 | $82,391 | $170,609 |
| 2022 | $2,511 | $248,600 | $76,891 | $171,709 |
| 2021 | $2,122 | $354,000 | $94,763 | $259,237 |
| 2020 | $2,100 | $321,000 | $84,887 | $236,113 |
| 2019 | $1,999 | $289,000 | $59,964 | $229,036 |
| 2018 | $1,953 | $270,000 | $59,964 | $210,036 |
| 2017 | $1,763 | $236,000 | $60,080 | $175,920 |
| 2016 | $1,644 | $118,811 | $32,719 | $86,092 |
| 2015 | $1,611 | $114,711 | $32,719 | $81,992 |
| 2014 | $1,510 | $104,642 | $32,719 | $71,923 |
Source: Public Records
Map
Nearby Homes
- 0 W 5500 S
- 5335 W 5500 S
- 6014 W 5300 S
- 3632 S 5400 W
- 3729 S 5600 W Unit 6
- 3720 S 5600 W Unit 2
- 3719 S 5600 W Unit 7
- 5947 W 4600 S
- 4879 S 5050 W
- 6036 W 4700 S
- 4909 W 5850 S
- 4700 W 5500 S
- 4931 S 4700 W
- 4632 W 5750 S
- 2462 N Hooded Crane Ct
- 2444 N Hooded Crane Cir Unit 11
- 5752 W 2425 N
- 4146 S 5800 W Unit 5
- 4163 S 5800 W Unit 2
- 4556 W 4950 S