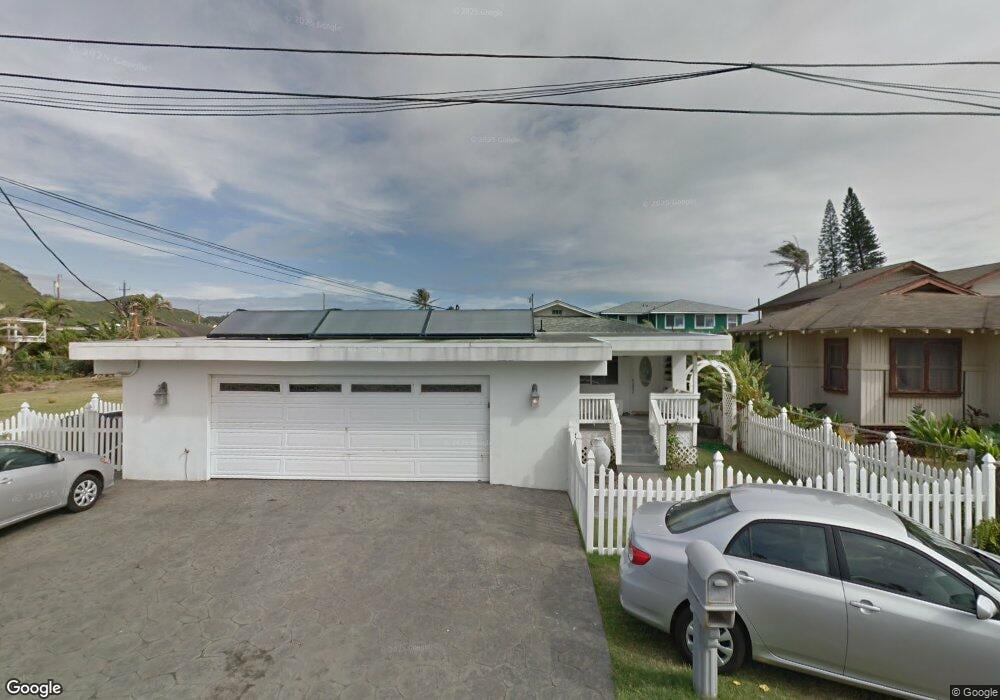
54-281 Kaipapau Loop Hauula, HI 96717
Estimated Value: $782,000 - $984,000
3
Beds
2
Baths
1,188
Sq Ft
$725/Sq Ft
Est. Value
About This Home
This home is located at 54-281 Kaipapau Loop, Hauula, HI 96717 and is currently estimated at $861,265, approximately $724 per square foot. 54-281 Kaipapau Loop is a home located in Honolulu County with nearby schools including Hau'ula Elementary School, Kahuku High & Intermediate School, and Asia Pacific International School.
Create a Home Valuation Report for This Property
The Home Valuation Report is an in-depth analysis detailing your home's value as well as a comparison with similar homes in the area
Home Values in the Area
Average Home Value in this Area
Tax History Compared to Growth
Tax History
| Year | Tax Paid | Tax Assessment Tax Assessment Total Assessment is a certain percentage of the fair market value that is determined by local assessors to be the total taxable value of land and additions on the property. | Land | Improvement |
|---|---|---|---|---|
| 2025 | $2,877 | $795,000 | $620,300 | $174,700 |
| 2024 | $2,877 | $821,900 | $650,800 | $171,100 |
| 2023 | $3,042 | $869,100 | $620,300 | $248,800 |
| 2022 | $2,707 | $773,300 | $465,200 | $308,100 |
| 2021 | $2,309 | $659,600 | $439,400 | $220,200 |
| 2020 | $2,097 | $599,100 | $439,400 | $159,700 |
| 2019 | $2,338 | $668,000 | $439,400 | $228,600 |
| 2018 | $2,087 | $596,200 | $387,700 | $208,500 |
| 2017 | $1,788 | $510,900 | $361,900 | $149,000 |
| 2016 | $1,778 | $508,000 | $341,200 | $166,800 |
| 2015 | $1,538 | $439,500 | $330,800 | $108,700 |
| 2014 | -- | $452,300 | $279,100 | $173,200 |
Source: Public Records
Map
Nearby Homes
- 54-220 Kaipapau Loop
- 54-225 Kaipapau Loop
- 54-259 Kaipapau Loop Unit B
- 54-253 Kaipapau Loop
- 54-265 Kaipapau Loop
- 54-004 Pipilani Place
- 54-016 Pipilani Place
- 54-223 Kamehameha Hwy
- 54-217 Kamehameha Hwy
- 200 Kamehameha Hwy
- 54-11 Waikulama St
- 54-18 Waikulama St
- 54-286 Hauula Homestead Rd
- 54-257 Honomu St
- 54-100 Kamehameha Hwy
- 54-222 Hauula Homestead Rd Unit A
- 54-222 Hauula Homestead Rd
- 54-230 Hauula Homestead Rd Unit A
- 55-137 Kamehameha Hwy Unit B
- 54-40 Kukuna Rd
- 54-279 Kaipapau Loop
- 54-287 Kaipapau Loop
- 54-275 Kaipapau Loop
- 54-018 Haukoi Place
- 54-18 Haukoi Place Unit Upstairs
- 54-18 Haukoi Place Unit Downstairs
- 54-280 Kaipapau Loop
- 54-278 Kaipapau Loop
- 54-284 Kaipapau Loop
- 54-273 Kaipapau Loop
- 54-286 Kaipapau Loop
- 54-274 Kaipapau Loop
- 54-292 Kaipapau Loop
- 54-272 Kaipapau Loop
- 54-269 Kaipapau Loop
- 54-232 Kaipapau Loop
- 54-238 Kaipapau Loop
- 54-230 Kaipapau Loop
- 54-008 Haukoi Place
- 54-025 Haukoi Place