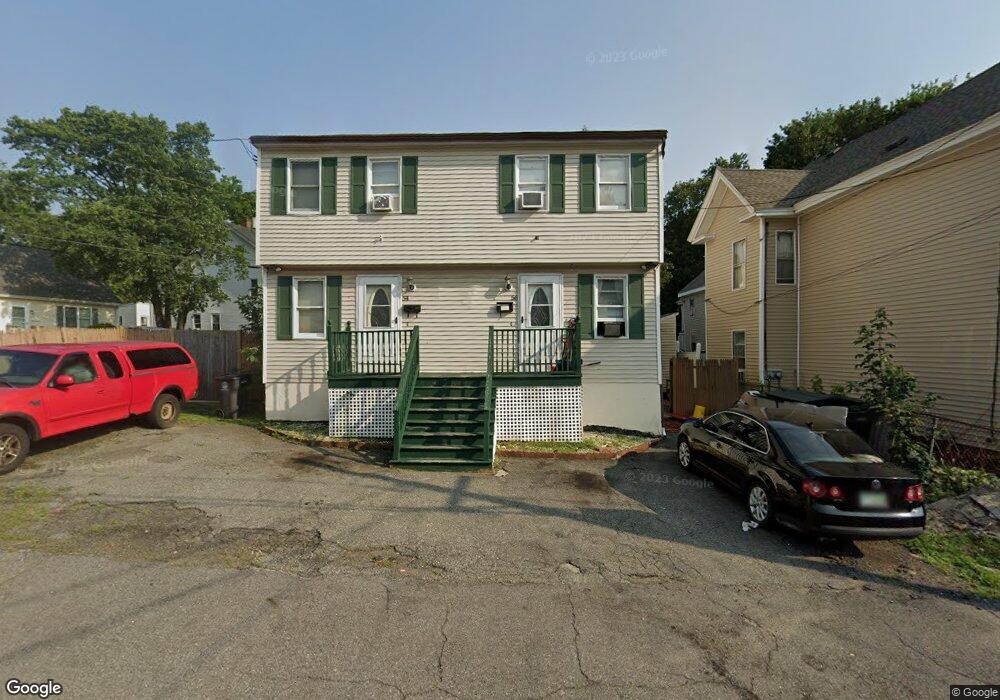
54 5th Ave Unit 56 Haverhill, MA 01830
Lower Acres NeighborhoodEstimated Value: $645,142 - $985,000
4
Beds
4
Baths
3,134
Sq Ft
$251/Sq Ft
Est. Value
About This Home
This home is located at 54 5th Ave Unit 56, Haverhill, MA 01830 and is currently estimated at $787,286, approximately $251 per square foot. 54 5th Ave Unit 56 is a home located in Essex County with nearby schools including Pentucket Lake Elementary School.
Ownership History
Date
Name
Owned For
Owner Type
Purchase Details
Closed on
Aug 21, 2017
Sold by
Veliz Bruce L and Veliz Joanne
Bought by
Veliz Bruce L
Current Estimated Value
Purchase Details
Closed on
Mar 14, 2005
Sold by
Tiburcio Rafael
Bought by
Veliz Bruce L
Purchase Details
Closed on
Jun 5, 2001
Sold by
Mejia Maritza and Mejia Jaime
Bought by
Tiburcio Rafael
Purchase Details
Closed on
Feb 3, 1998
Sold by
Garwich 54-56 T and Garwich Lagasse
Bought by
Mejia Maritza and Mejia Jamie
Create a Home Valuation Report for This Property
The Home Valuation Report is an in-depth analysis detailing your home's value as well as a comparison with similar homes in the area
Home Values in the Area
Average Home Value in this Area
Purchase History
| Date | Buyer | Sale Price | Title Company |
|---|---|---|---|
| Veliz Bruce L | -- | -- | |
| Veliz Bruce L | $375,000 | -- | |
| Tiburcio Rafael | $199,000 | -- | |
| Mejia Maritza | $108,500 | -- |
Source: Public Records
Mortgage History
| Date | Status | Borrower | Loan Amount |
|---|---|---|---|
| Previous Owner | Mejia Maritza | $330,977 | |
| Previous Owner | Mejia Maritza | $337,995 |
Source: Public Records
Tax History Compared to Growth
Tax History
| Year | Tax Paid | Tax Assessment Tax Assessment Total Assessment is a certain percentage of the fair market value that is determined by local assessors to be the total taxable value of land and additions on the property. | Land | Improvement |
|---|---|---|---|---|
| 2025 | $6,028 | $562,800 | $143,700 | $419,100 |
| 2024 | $5,215 | $490,100 | $142,100 | $348,000 |
| 2023 | $4,864 | $436,200 | $130,000 | $306,200 |
| 2022 | $4,820 | $378,900 | $117,900 | $261,000 |
| 2021 | $4,454 | $331,400 | $102,800 | $228,600 |
| 2020 | $4,258 | $313,100 | $95,300 | $217,800 |
| 2019 | $4,050 | $290,300 | $83,200 | $207,100 |
| 2018 | $4,074 | $285,700 | $78,600 | $207,100 |
| 2017 | $3,786 | $252,600 | $63,500 | $189,100 |
| 2016 | $3,542 | $230,600 | $63,500 | $167,100 |
| 2015 | $3,540 | $230,600 | $63,500 | $167,100 |
Source: Public Records
Map
Nearby Homes