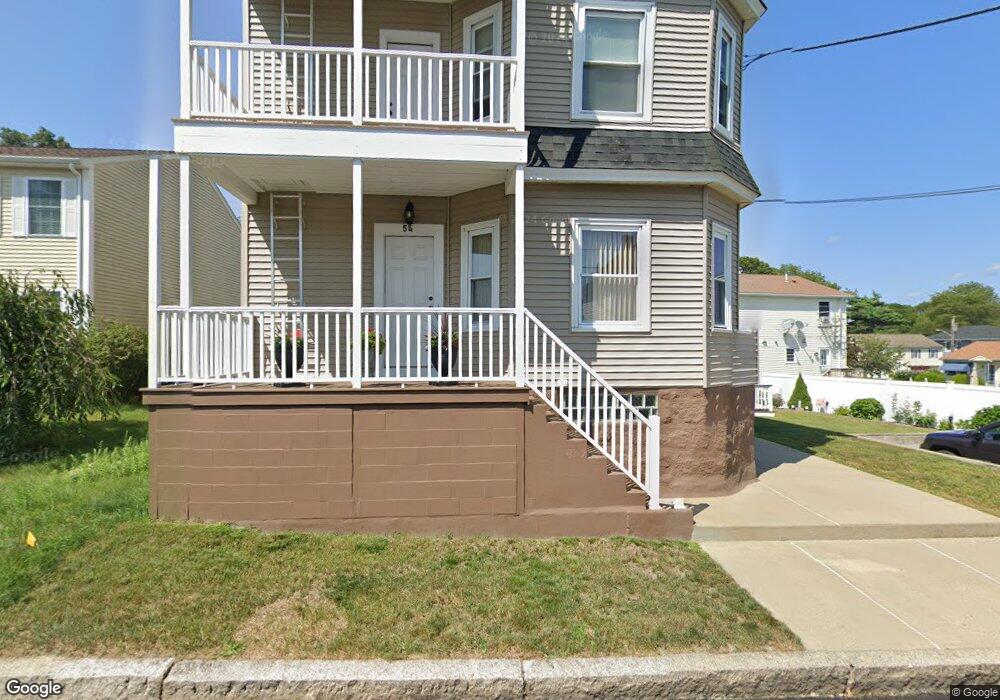
54 Alsop St Unit 2 Fall River, MA 02723
Flint NeighborhoodEstimated Value: $571,000 - $715,000
2
Beds
1
Bath
1,200
Sq Ft
$539/Sq Ft
Est. Value
About This Home
This home is located at 54 Alsop St Unit 2, Fall River, MA 02723 and is currently estimated at $647,037, approximately $539 per square foot. 54 Alsop St Unit 2 is a home located in Bristol County with nearby schools including Samuel Watson, Talbot Innovation School, and B M C Durfee High School.
Ownership History
Date
Name
Owned For
Owner Type
Purchase Details
Closed on
Nov 7, 2011
Sold by
Cordeiro Jose M
Bought by
Cordeiro Jose M and Cordeiro Maria S
Current Estimated Value
Home Financials for this Owner
Home Financials are based on the most recent Mortgage that was taken out on this home.
Original Mortgage
$175,000
Outstanding Balance
$119,850
Interest Rate
4.11%
Mortgage Type
Purchase Money Mortgage
Estimated Equity
$527,187
Purchase Details
Closed on
Oct 28, 2011
Sold by
Dream Homes Inc
Bought by
Cordeiro Jose M
Home Financials for this Owner
Home Financials are based on the most recent Mortgage that was taken out on this home.
Original Mortgage
$175,000
Outstanding Balance
$119,850
Interest Rate
4.11%
Mortgage Type
Purchase Money Mortgage
Estimated Equity
$527,187
Purchase Details
Closed on
Jan 14, 2005
Sold by
Ponton Michael W and Ponton Yvonne M
Bought by
Dream Homes Inc
Create a Home Valuation Report for This Property
The Home Valuation Report is an in-depth analysis detailing your home's value as well as a comparison with similar homes in the area
Home Values in the Area
Average Home Value in this Area
Purchase History
| Date | Buyer | Sale Price | Title Company |
|---|---|---|---|
| Cordeiro Jose M | -- | -- | |
| Cordeiro Jose M | -- | -- | |
| Cordeiro Jose M | $225,000 | -- | |
| Cordeiro Jose M | $225,000 | -- | |
| Dream Homes Inc | $420,000 | -- | |
| Dream Homes Inc | $420,000 | -- |
Source: Public Records
Mortgage History
| Date | Status | Borrower | Loan Amount |
|---|---|---|---|
| Open | Cordeiro Jose M | $175,000 | |
| Closed | Dream Homes Inc | $175,000 | |
| Previous Owner | Dream Homes Inc | $154,000 |
Source: Public Records
Tax History
| Year | Tax Paid | Tax Assessment Tax Assessment Total Assessment is a certain percentage of the fair market value that is determined by local assessors to be the total taxable value of land and additions on the property. | Land | Improvement |
|---|---|---|---|---|
| 2025 | $6,194 | $541,000 | $114,500 | $426,500 |
| 2024 | $5,083 | $442,400 | $112,300 | $330,100 |
| 2023 | $4,561 | $371,700 | $101,200 | $270,500 |
| 2022 | $4,084 | $323,600 | $95,500 | $228,100 |
| 2021 | $3,795 | $274,400 | $91,200 | $183,200 |
| 2020 | $3,432 | $237,500 | $87,000 | $150,500 |
| 2019 | $3,092 | $212,100 | $91,000 | $121,100 |
| 2018 | $2,756 | $188,500 | $91,600 | $96,900 |
| 2017 | $2,639 | $188,500 | $91,600 | $96,900 |
| 2016 | $2,576 | $189,000 | $94,400 | $94,600 |
| 2015 | $2,472 | $189,000 | $94,400 | $94,600 |
| 2014 | $2,485 | $197,500 | $94,400 | $103,100 |
Source: Public Records
Map
Nearby Homes
- 34 Alsop St
- 116 Irving St
- 38 Eaton St
- 1792 Pleasant St Unit 1808
- 219 Earle St Unit 3
- 217 Earle St Unit 2
- 215 Earle St Unit 1
- 352 Barnes St
- 712 Eastern Ave
- 157 Earle St
- 3 Edgemond St
- 366 Alden St
- 144 Choate St
- 31 Choate St
- 756 County St
- 529 Eastern Ave
- 152 Alden St
- 580 County St
- 178 Thomas St
- 25 Lebanon St Unit D
Your Personal Tour Guide
Ask me questions while you tour the home.