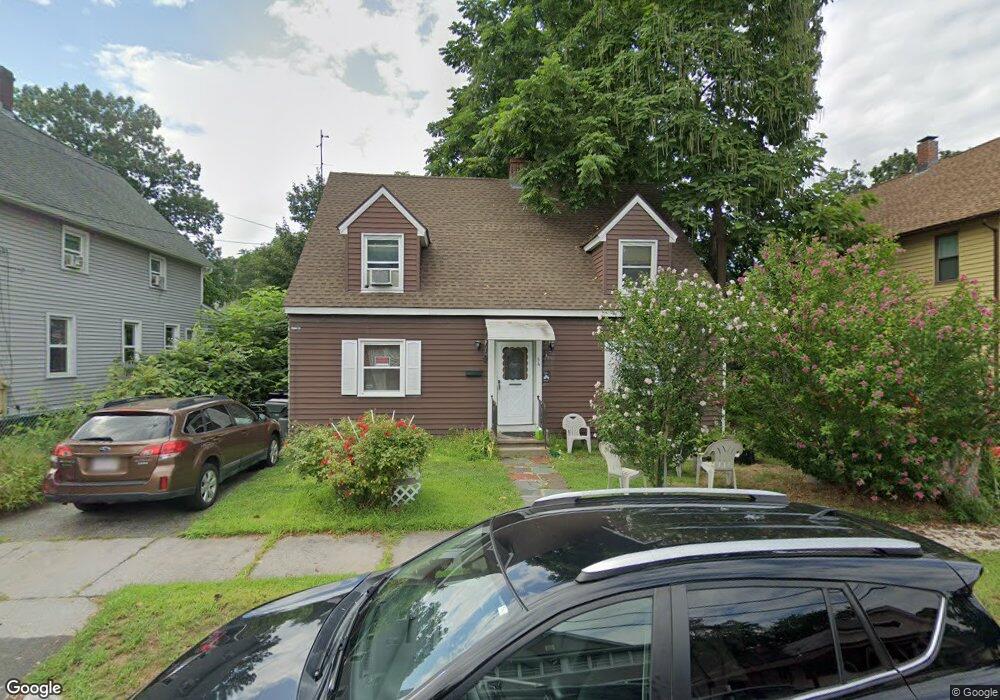
54 Bevier St Springfield, MA 01107
Liberty Heights NeighborhoodEstimated Value: $204,000 - $295,346
4
Beds
2
Baths
1,910
Sq Ft
$138/Sq Ft
Est. Value
About This Home
This home is located at 54 Bevier St, Springfield, MA 01107 and is currently estimated at $263,337, approximately $137 per square foot. 54 Bevier St is a home located in Hampden County with nearby schools including Glenwood School, Van Sickle Academy, and High School Of Commerce.
Ownership History
Date
Name
Owned For
Owner Type
Purchase Details
Closed on
Nov 1, 2024
Sold by
Sareen Properties Llc
Bought by
Cyr Edward J
Current Estimated Value
Home Financials for this Owner
Home Financials are based on the most recent Mortgage that was taken out on this home.
Original Mortgage
$177,750
Outstanding Balance
$175,604
Interest Rate
6.09%
Mortgage Type
Purchase Money Mortgage
Estimated Equity
$87,733
Purchase Details
Closed on
Aug 15, 2024
Sold by
Cascade Funding Mtg T Hb4 and Wilmington Svgs Fund Soc
Bought by
Sareen Properties Llc
Purchase Details
Closed on
Oct 18, 2022
Sold by
Cyr Ernest W and Bk Of Ny Mellon T Co Na T
Bought by
Cascade Funding Mtg T Hb4 and Wilmington Svgs Fund Soc
Purchase Details
Closed on
Oct 8, 1971
Bought by
Cyr Ernest W and Cyr Helen A
Create a Home Valuation Report for This Property
The Home Valuation Report is an in-depth analysis detailing your home's value as well as a comparison with similar homes in the area
Home Values in the Area
Average Home Value in this Area
Purchase History
| Date | Buyer | Sale Price | Title Company |
|---|---|---|---|
| Cyr Edward J | $199,000 | None Available | |
| Cyr Edward J | $199,000 | None Available | |
| Cyr Edward J | $199,000 | None Available | |
| Sareen Properties Llc | $169,000 | None Available | |
| Sareen Properties Llc | $169,000 | None Available | |
| Sareen Properties Llc | $169,000 | None Available | |
| Cascade Funding Mtg T Hb4 | $217,273 | None Available | |
| Wilmington Svgs Fund Soc | $217,273 | None Available | |
| -- | $217,273 | None Available | |
| Cyr Ernest W | $18,900 | -- |
Source: Public Records
Mortgage History
| Date | Status | Borrower | Loan Amount |
|---|---|---|---|
| Open | Cyr Edward J | $177,750 | |
| Closed | Cyr Edward J | $177,750 | |
| Previous Owner | Cyr Ernest W | $240,000 | |
| Previous Owner | Cyr Ernest W | $26,000 |
Source: Public Records
Tax History
| Year | Tax Paid | Tax Assessment Tax Assessment Total Assessment is a certain percentage of the fair market value that is determined by local assessors to be the total taxable value of land and additions on the property. | Land | Improvement |
|---|---|---|---|---|
| 2025 | $4,152 | $264,800 | $38,500 | $226,300 |
| 2024 | $3,870 | $241,000 | $38,500 | $202,500 |
| 2023 | $3,645 | $213,800 | $34,100 | $179,700 |
| 2022 | $2,923 | $155,300 | $31,900 | $123,400 |
| 2021 | $2,880 | $152,400 | $29,000 | $123,400 |
| 2020 | $2,906 | $148,800 | $29,000 | $119,800 |
| 2019 | $2,777 | $141,100 | $31,500 | $109,600 |
| 2018 | $2,798 | $142,200 | $31,500 | $110,700 |
| 2017 | $2,733 | $139,000 | $28,500 | $110,500 |
| 2016 | $2,623 | $133,400 | $27,000 | $106,400 |
| 2015 | $2,473 | $125,700 | $27,000 | $98,700 |
Source: Public Records
Map
Nearby Homes
- 118 Wait St
- 121 Wait St
- 211-213 Chapin Terrace
- 1078 Liberty St
- 708-710 Carew St
- 24 Melha Ave
- 744-746 Carew St
- 571-573 Carew St
- 491-493 Newbury St
- 774-776 Liberty St
- Lot 1 Marion St
- 248 Hampden St
- 57 Narragansett St
- 2 Marion St
- 21 Merwin St
- 78 Prospect St
- 27 Parallel St
- 148-150 Stafford St
- 119 Littleton St
- 61 Abbey Memorial Dr Unit 153
- 48 Bevier St
- 64 Bevier St
- 53 Sterling St
- 42 Bevier St
- 57 Sterling St Unit 59
- 47 Sterling St Unit 49
- 68 Bevier St
- 51-53 Sterling St
- 63 Sterling St Unit 65
- 43 Sterling St Unit 45
- 51 Sterling St
- 53 Bevier St
- 43 Sterling St
- 57 Bevier St
- 47 Bevier St
- 38 Bevier St
- 67 Sterling St Unit 69
- 39 Sterling St Unit 41
- 39-41 Sterling St
- 61 Bevier St
Your Personal Tour Guide
Ask me questions while you tour the home.