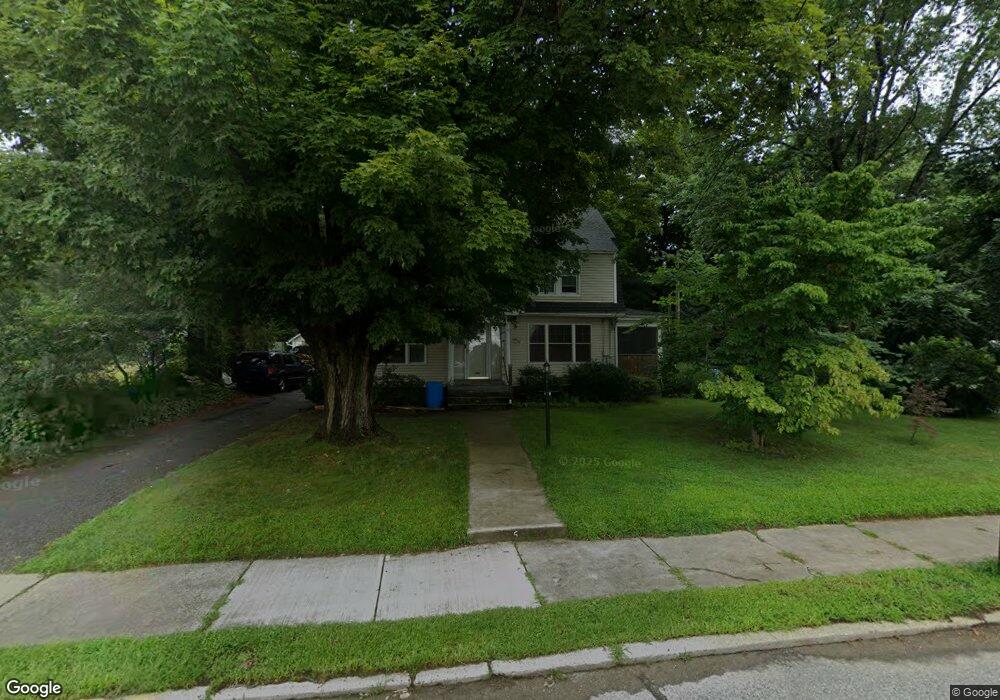
54 Broad St Danielson, CT 06239
Estimated Value: $329,000 - $376,000
4
Beds
2
Baths
1,632
Sq Ft
$216/Sq Ft
Est. Value
About This Home
This home is located at 54 Broad St, Danielson, CT 06239 and is currently estimated at $351,914, approximately $215 per square foot. 54 Broad St is a home located in Windham County with nearby schools including Killingly Central School, Killingly Memorial School, and Killingly Intermediate School.
Ownership History
Date
Name
Owned For
Owner Type
Purchase Details
Closed on
Mar 23, 2020
Sold by
Stonge Joanne L
Bought by
Stonge Joanne L and Stonge Kirk L
Current Estimated Value
Purchase Details
Closed on
Feb 19, 1999
Sold by
Chabot Dorothy P
Bought by
Stonge Joanne L
Purchase Details
Closed on
Oct 4, 1994
Sold by
Chabot Dorothy P
Bought by
Chappell Steven K and Chappell Theresa
Create a Home Valuation Report for This Property
The Home Valuation Report is an in-depth analysis detailing your home's value as well as a comparison with similar homes in the area
Home Values in the Area
Average Home Value in this Area
Purchase History
| Date | Buyer | Sale Price | Title Company |
|---|---|---|---|
| Stonge Joanne L | -- | None Available | |
| Stonge Joanne L | -- | None Available | |
| Stonge Joanne L | $89,000 | -- | |
| Stonge Joanne L | $89,000 | -- | |
| Chappell Steven K | $110,000 | -- | |
| Chappell Steven K | $110,000 | -- |
Source: Public Records
Mortgage History
| Date | Status | Borrower | Loan Amount |
|---|---|---|---|
| Previous Owner | Chappell Steven K | $162,000 | |
| Previous Owner | Chappell Steven K | $161,500 | |
| Previous Owner | Chappell Steven K | $127,000 |
Source: Public Records
Tax History
| Year | Tax Paid | Tax Assessment Tax Assessment Total Assessment is a certain percentage of the fair market value that is determined by local assessors to be the total taxable value of land and additions on the property. | Land | Improvement |
|---|---|---|---|---|
| 2025 | $4,126 | $164,720 | $30,940 | $133,780 |
| 2024 | $3,939 | $164,720 | $30,940 | $133,780 |
| 2023 | $4,560 | $142,100 | $25,480 | $116,620 |
| 2022 | $4,290 | $142,100 | $25,480 | $116,620 |
| 2021 | $4,290 | $142,100 | $25,480 | $116,620 |
| 2020 | $4,219 | $142,100 | $25,480 | $116,620 |
| 2019 | $4,264 | $142,100 | $25,480 | $116,620 |
| 2017 | $3,464 | $107,380 | $16,380 | $91,000 |
| 2016 | $3,392 | $105,140 | $16,380 | $88,760 |
| 2015 | $3,323 | $105,140 | $16,380 | $88,760 |
| 2014 | $3,245 | $105,140 | $16,380 | $88,760 |
Source: Public Records
Map
Nearby Homes
Your Personal Tour Guide
Ask me questions while you tour the home.