Estimated Value: $482,922 - $612,000
2
Beds
2
Baths
1,088
Sq Ft
$491/Sq Ft
Est. Value
About This Home
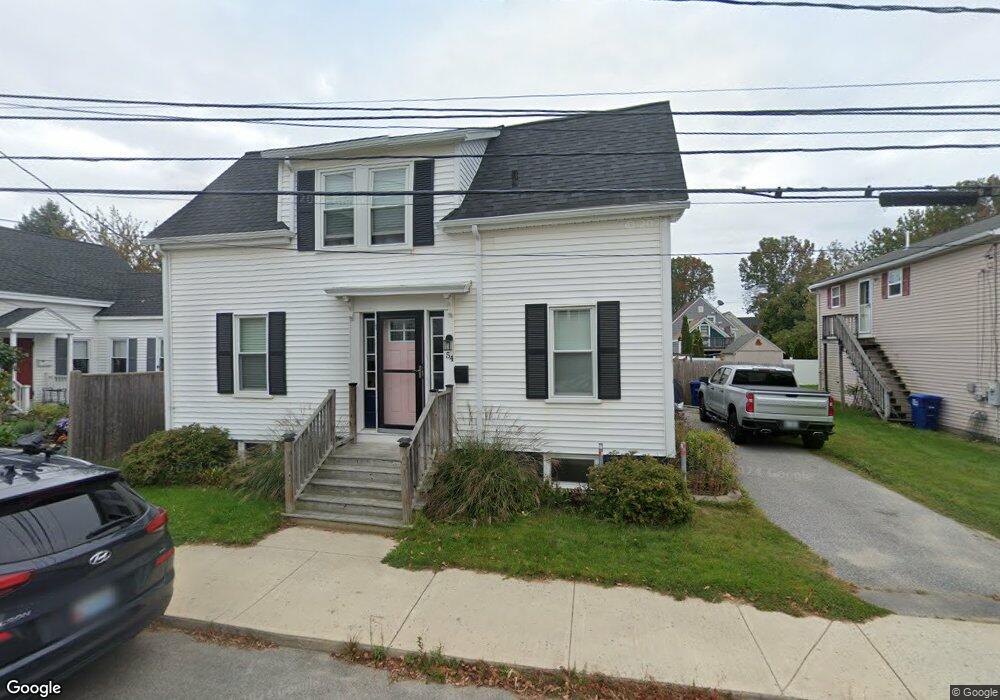
This home is located at 54 C St, South Portland, ME 04106 and is currently estimated at $534,481, approximately $491 per square foot. 54 C St is a home located in Cumberland County with nearby schools including Birmingham Covington School, Frank I. Brown Elementary School, and Holy Cross School.
Ownership History
Date
Name
Owned For
Owner Type
Purchase Details
Closed on
Dec 10, 2019
Sold by
Bracy Deanna L
Bought by
Bracy Deanna L and Bracy Mandy L
Current Estimated Value
Home Financials for this Owner
Home Financials are based on the most recent Mortgage that was taken out on this home.
Original Mortgage
$180,000
Interest Rate
3.7%
Mortgage Type
New Conventional
Purchase Details
Closed on
Nov 3, 2006
Sold by
Perley Kenton B
Bought by
Perley Mollie H and Boucher Jennifer K
Home Financials for this Owner
Home Financials are based on the most recent Mortgage that was taken out on this home.
Original Mortgage
$143,250
Interest Rate
6.47%
Mortgage Type
FHA
Create a Home Valuation Report for This Property
The Home Valuation Report is an in-depth analysis detailing your home's value as well as a comparison with similar homes in the area
Home Values in the Area
Average Home Value in this Area
Purchase History
| Date | Buyer | Sale Price | Title Company |
|---|---|---|---|
| Bracy Deanna L | -- | None Available | |
| Bracy Deanna L | -- | None Available | |
| Perley Mollie H | -- | -- | |
| Perley Mollie H | -- | -- | |
| Perley Mollie H | -- | -- |
Source: Public Records
Mortgage History
| Date | Status | Borrower | Loan Amount |
|---|---|---|---|
| Closed | Bracy Deanna L | $180,000 | |
| Closed | Perley Mollie H | $172,812 | |
| Closed | Perley Mollie H | $143,250 |
Source: Public Records
Tax History Compared to Growth
Tax History
| Year | Tax Paid | Tax Assessment Tax Assessment Total Assessment is a certain percentage of the fair market value that is determined by local assessors to be the total taxable value of land and additions on the property. | Land | Improvement |
|---|---|---|---|---|
| 2024 | $4,609 | $349,200 | $162,900 | $186,300 |
| 2023 | $3,939 | $278,600 | $115,200 | $163,400 |
| 2022 | $3,714 | $238,700 | $92,100 | $146,600 |
| 2021 | $3,509 | $238,700 | $92,100 | $146,600 |
| 2020 | $3,233 | $163,700 | $73,700 | $90,000 |
| 2019 | $3,127 | $163,700 | $73,700 | $90,000 |
| 2018 | $3,104 | $167,800 | $73,700 | $94,100 |
| 2017 | $3,020 | $167,800 | $73,700 | $94,100 |
| 2016 | $2,851 | $161,100 | $67,000 | $94,100 |
| 2015 | $2,803 | $161,100 | $67,000 | $94,100 |
| 2014 | $2,584 | $161,100 | $67,000 | $94,100 |
| 2013 | -- | $161,100 | $67,000 | $94,100 |
Source: Public Records
Map
Nearby Homes