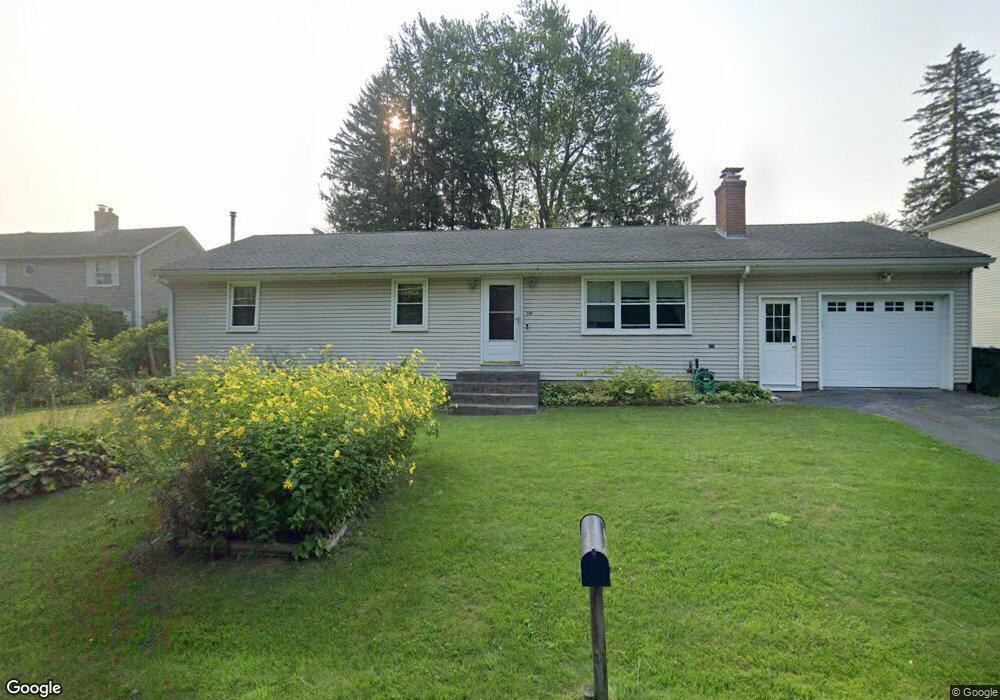
54 Cannon St Windsor Locks, CT 06096
Estimated Value: $274,000 - $315,632
3
Beds
2
Baths
1,296
Sq Ft
$231/Sq Ft
Est. Value
About This Home
This home is located at 54 Cannon St, Windsor Locks, CT 06096 and is currently estimated at $299,908, approximately $231 per square foot. 54 Cannon St is a home located in Hartford County with nearby schools including North Street School, South Elementary School, and Windsor Locks Middle School.
Ownership History
Date
Name
Owned For
Owner Type
Purchase Details
Closed on
Nov 1, 2004
Sold by
Dixon Judith
Bought by
Dixon Todd
Current Estimated Value
Home Financials for this Owner
Home Financials are based on the most recent Mortgage that was taken out on this home.
Original Mortgage
$135,000
Outstanding Balance
$66,724
Interest Rate
5.74%
Estimated Equity
$233,184
Purchase Details
Closed on
Sep 21, 1994
Sold by
Dubois Gilman and Dubois Mildred
Bought by
Pete Allen and Pete Anne
Create a Home Valuation Report for This Property
The Home Valuation Report is an in-depth analysis detailing your home's value as well as a comparison with similar homes in the area
Home Values in the Area
Average Home Value in this Area
Purchase History
| Date | Buyer | Sale Price | Title Company |
|---|---|---|---|
| Dixon Todd | $150,000 | -- | |
| Pete Allen | $100,000 | -- |
Source: Public Records
Mortgage History
| Date | Status | Borrower | Loan Amount |
|---|---|---|---|
| Open | Pete Allen | $135,000 | |
| Previous Owner | Pete Allen | $99,094 | |
| Previous Owner | Pete Allen | $104,405 |
Source: Public Records
Tax History Compared to Growth
Tax History
| Year | Tax Paid | Tax Assessment Tax Assessment Total Assessment is a certain percentage of the fair market value that is determined by local assessors to be the total taxable value of land and additions on the property. | Land | Improvement |
|---|---|---|---|---|
| 2025 | $4,883 | $203,560 | $58,380 | $145,180 |
| 2024 | $3,162 | $112,350 | $41,580 | $70,770 |
| 2023 | $2,958 | $112,350 | $41,580 | $70,770 |
| 2022 | $2,902 | $112,350 | $41,580 | $70,770 |
| 2021 | $2,902 | $112,350 | $41,580 | $70,770 |
| 2020 | $2,902 | $112,350 | $41,580 | $70,770 |
| 2019 | $2,902 | $112,350 | $41,580 | $70,770 |
| 2017 | $2,767 | $103,800 | $38,800 | $65,000 |
| 2016 | $2,767 | $103,800 | $38,800 | $65,000 |
| 2015 | $2,781 | $103,800 | $38,800 | $65,000 |
| 2014 | $3,292 | $125,500 | $44,100 | $81,400 |
Source: Public Records
Map
Nearby Homes
- 15 Dickerman Ave
- 29 Chester Dr
- 19 Thomas St
- 15 Suffield St
- 202 Reed Ave
- 3 Pleasant St
- 75 N Main St
- 66 Center St
- 140 Spring St
- 10 Center St
- 190 Elm St
- 7 Glenbrook Dr
- 114 Elm St
- 59 Elm St
- 0 N Water St Unit 24138494
- 0 N Water St Unit 24128295
- 0 N Water St Unit 24128294
- 0 N Water St Unit 24128288
- 0 N Water St
- 10 Woodland Hollow St