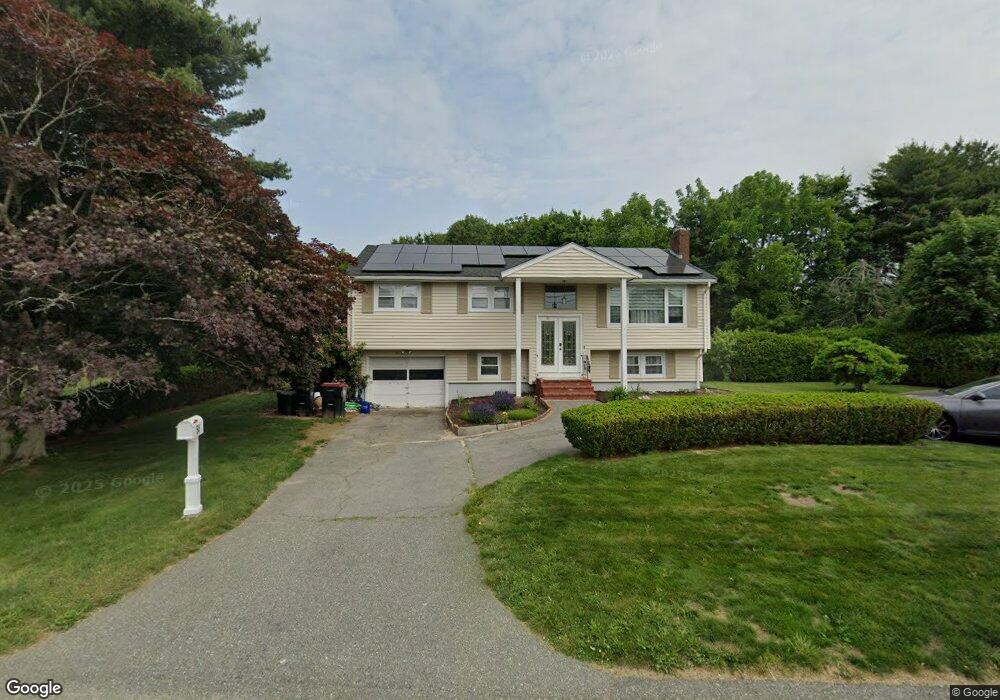
54 Carlisle St Brockton, MA 02302
Estimated Value: $574,034 - $605,000
3
Beds
2
Baths
1,836
Sq Ft
$321/Sq Ft
Est. Value
About This Home
This home is located at 54 Carlisle St, Brockton, MA 02302 and is currently estimated at $589,009, approximately $320 per square foot. 54 Carlisle St is a home located in Plymouth County with nearby schools including Davis K-8 School, John F. Kennedy Elementary School, and South Middle School.
Ownership History
Date
Name
Owned For
Owner Type
Purchase Details
Closed on
Dec 17, 2020
Sold by
Rcv Rt
Bought by
Depina Carlos and Depine Virginia L
Current Estimated Value
Home Financials for this Owner
Home Financials are based on the most recent Mortgage that was taken out on this home.
Original Mortgage
$320,000
Outstanding Balance
$284,895
Interest Rate
2.7%
Mortgage Type
New Conventional
Estimated Equity
$304,114
Purchase Details
Closed on
Feb 27, 2014
Sold by
Depina Carlos
Bought by
Rcv Rt
Create a Home Valuation Report for This Property
The Home Valuation Report is an in-depth analysis detailing your home's value as well as a comparison with similar homes in the area
Home Values in the Area
Average Home Value in this Area
Purchase History
| Date | Buyer | Sale Price | Title Company |
|---|---|---|---|
| Depina Carlos | $400,000 | None Available | |
| Rcv Rt | -- | -- |
Source: Public Records
Mortgage History
| Date | Status | Borrower | Loan Amount |
|---|---|---|---|
| Open | Depina Carlos | $320,000 |
Source: Public Records
Tax History Compared to Growth
Tax History
| Year | Tax Paid | Tax Assessment Tax Assessment Total Assessment is a certain percentage of the fair market value that is determined by local assessors to be the total taxable value of land and additions on the property. | Land | Improvement |
|---|---|---|---|---|
| 2025 | $6,323 | $522,100 | $169,000 | $353,100 |
| 2024 | $5,938 | $494,000 | $169,000 | $325,000 |
| 2023 | $5,937 | $457,400 | $120,300 | $337,100 |
| 2022 | $5,381 | $385,200 | $109,300 | $275,900 |
| 2021 | $5,197 | $358,400 | $101,100 | $257,300 |
| 2020 | $5,304 | $350,100 | $88,100 | $262,000 |
| 2019 | $5,231 | $336,600 | $84,500 | $252,100 |
| 2018 | $4,474 | $308,900 | $84,500 | $224,400 |
| 2017 | $4,474 | $277,900 | $84,500 | $193,400 |
| 2016 | $4,446 | $256,100 | $80,700 | $175,400 |
| 2015 | $4,233 | $233,200 | $80,700 | $152,500 |
| 2014 | $4,050 | $223,400 | $80,700 | $142,700 |
Source: Public Records
Map
Nearby Homes