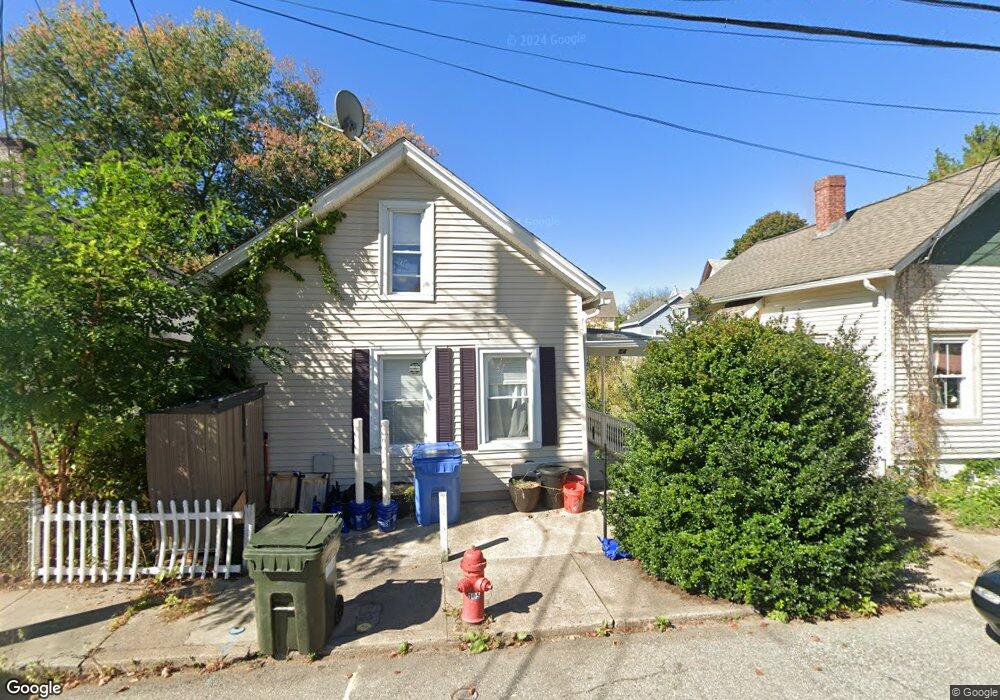
54 Cedar St Norwich, CT 06360
Central Norwich NeighborhoodEstimated Value: $87,000 - $224,000
3
Beds
1
Bath
1,080
Sq Ft
$158/Sq Ft
Est. Value
About This Home
This home is located at 54 Cedar St, Norwich, CT 06360 and is currently estimated at $170,310, approximately $157 per square foot. 54 Cedar St is a home located in New London County with nearby schools including Samuel Huntington Elementary School, Kelly STEAM Magnet Middle School, and Integrated Day Charter School.
Ownership History
Date
Name
Owned For
Owner Type
Purchase Details
Closed on
Sep 15, 2021
Sold by
Mackiewicz John P
Bought by
Mack Estates Llc
Current Estimated Value
Purchase Details
Closed on
Jun 15, 2021
Sold by
Mack Estates Llc
Bought by
Mackiewicz John P
Purchase Details
Closed on
Nov 18, 2020
Sold by
Palazzo Russell and Quarto James
Bought by
Mack Estates Llc
Purchase Details
Closed on
Jul 12, 2005
Sold by
Gama Gary
Bought by
Quarto James and Palazzo Russell
Create a Home Valuation Report for This Property
The Home Valuation Report is an in-depth analysis detailing your home's value as well as a comparison with similar homes in the area
Home Values in the Area
Average Home Value in this Area
Purchase History
| Date | Buyer | Sale Price | Title Company |
|---|---|---|---|
| Mack Estates Llc | -- | None Available | |
| Mack Estates Llc | -- | None Available | |
| Mackiewicz John P | -- | None Available | |
| Mackiewicz John P | -- | None Available | |
| Mack Estates Llc | $46,500 | None Available | |
| Mack Estates Llc | $46,500 | None Available | |
| Mack Estates Llc | $46,500 | None Available | |
| Quarto James | $74,000 | -- | |
| Quarto James | $74,000 | -- |
Source: Public Records
Mortgage History
| Date | Status | Borrower | Loan Amount |
|---|---|---|---|
| Previous Owner | Quarto James | $45,000 |
Source: Public Records
Tax History
| Year | Tax Paid | Tax Assessment Tax Assessment Total Assessment is a certain percentage of the fair market value that is determined by local assessors to be the total taxable value of land and additions on the property. | Land | Improvement |
|---|---|---|---|---|
| 2025 | $2,886 | $71,300 | $18,300 | $53,000 |
| 2024 | $2,724 | $71,300 | $18,300 | $53,000 |
| 2023 | $2,189 | $45,000 | $12,900 | $32,100 |
| 2022 | $2,182 | $45,000 | $12,900 | $32,100 |
| 2021 | $2,189 | $45,000 | $12,900 | $32,100 |
| 2020 | $2,181 | $45,000 | $12,900 | $32,100 |
| 2019 | $2,160 | $45,000 | $12,900 | $32,100 |
| 2018 | $2,299 | $47,500 | $15,200 | $32,300 |
| 2017 | $2,315 | $47,500 | $15,200 | $32,300 |
| 2016 | $2,330 | $47,500 | $15,200 | $32,300 |
| 2015 | $2,283 | $47,500 | $15,200 | $32,300 |
| 2014 | $2,182 | $47,500 | $15,200 | $32,300 |
Source: Public Records
Map
Nearby Homes
- 9 Washington St
- 21 Buckingham Ave
- 34 Buckingham Ave
- 14 Sturtevant Ave
- 40 Maple Grove Ave
- 185 Broadway
- 220 Franklin St
- 4 Robbins Ct
- 44 Summer St
- 39 Cliff St
- 28 Perkins Ave
- 22 Hawthorne St
- 51 Cliff St Unit 53
- 33 Division St
- 76 Laurel Hill Ave
- 78 Mckinley Ave
- 125 Talman St
- 13 Curtis St
- 10 Rockwell St
- 182 Broad St
Your Personal Tour Guide
Ask me questions while you tour the home.