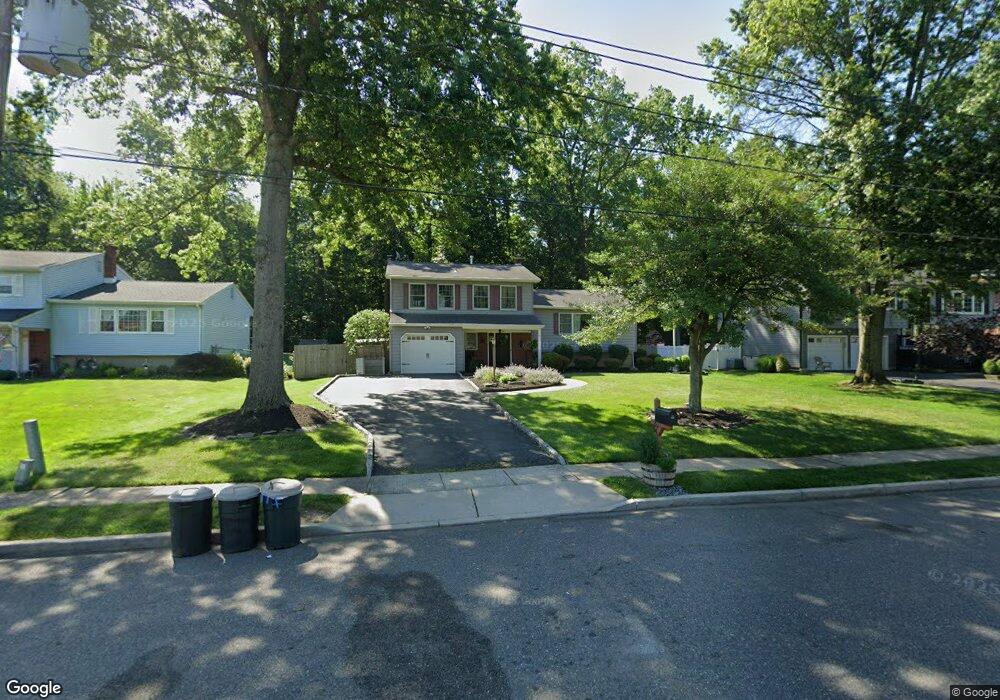
54 Chipper Dr Kendall Park, NJ 08824
Estimated Value: $626,369 - $745,000
Studio
--
Bath
2,256
Sq Ft
$300/Sq Ft
Est. Value
About This Home
This home is located at 54 Chipper Dr, Kendall Park, NJ 08824 and is currently estimated at $677,092, approximately $300 per square foot. 54 Chipper Dr is a home located in Middlesex County with nearby schools including Brunswick Acres Elementary School, Crossroads South Middle School, and South Brunswick High School.
Ownership History
Date
Name
Owned For
Owner Type
Purchase Details
Closed on
Feb 27, 2002
Sold by
Mula Frederick
Bought by
Galella Michael and Galella Elizabeth
Current Estimated Value
Home Financials for this Owner
Home Financials are based on the most recent Mortgage that was taken out on this home.
Original Mortgage
$244,000
Outstanding Balance
$101,781
Interest Rate
7.04%
Estimated Equity
$575,311
Create a Home Valuation Report for This Property
The Home Valuation Report is an in-depth analysis detailing your home's value as well as a comparison with similar homes in the area
Home Values in the Area
Average Home Value in this Area
Purchase History
| Date | Buyer | Sale Price | Title Company |
|---|---|---|---|
| Galella Michael | $305,000 | -- |
Source: Public Records
Mortgage History
| Date | Status | Borrower | Loan Amount |
|---|---|---|---|
| Open | Galella Michael | $244,000 |
Source: Public Records
Tax History
| Year | Tax Paid | Tax Assessment Tax Assessment Total Assessment is a certain percentage of the fair market value that is determined by local assessors to be the total taxable value of land and additions on the property. | Land | Improvement |
|---|---|---|---|---|
| 2025 | $10,347 | $190,000 | $83,100 | $106,900 |
| 2024 | $9,975 | $190,000 | $83,100 | $106,900 |
| 2023 | $9,975 | $190,000 | $83,100 | $106,900 |
| 2022 | $9,682 | $190,000 | $83,100 | $106,900 |
| 2021 | $7,447 | $190,000 | $83,100 | $106,900 |
| 2020 | $9,736 | $190,000 | $83,100 | $106,900 |
| 2019 | $9,821 | $190,000 | $83,100 | $106,900 |
| 2018 | $9,500 | $190,000 | $83,100 | $106,900 |
| 2017 | $9,485 | $190,000 | $83,100 | $106,900 |
| 2016 | $9,384 | $190,000 | $83,100 | $106,900 |
| 2015 | $9,099 | $190,000 | $83,100 | $106,900 |
| 2014 | $8,953 | $190,000 | $83,100 | $106,900 |
Source: Public Records
Map
Nearby Homes
- 28 Chipper Dr
- 1 Joshua Ct
- 0 Finnegans Ln Ave B Unit NJMX2010364
- 32 Tanglewood Ct
- 50 Tanglewood Ct
- 21 Crestview Dr
- 3803 Us 1
- 41 Aspen Dr
- 1124 Staghorn Dr
- 3 Clinton Ct
- 10 Gillian Dr
- 1497 Thomas Ave
- 23 Twain Rd
- 10 Twain Rd
- 2 Rachel Ct Unit 2
- 2 Rachel Ct
- 9 Beekman Rd
- 5 Woodmere Rd
- 6 Brittany Way
- 163 Deans Ln
Your Personal Tour Guide
Ask me questions while you tour the home.