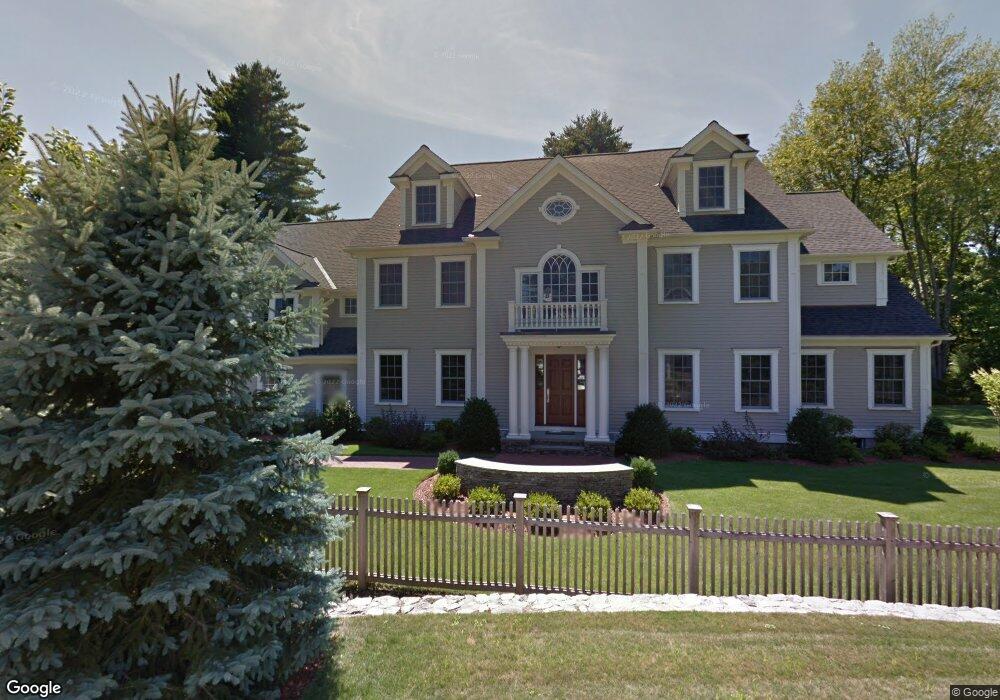
54 Colony Rd Lexington, MA 02420
Munroe Hill NeighborhoodEstimated Value: $1,795,000 - $3,696,000
4
Beds
2
Baths
1,855
Sq Ft
$1,603/Sq Ft
Est. Value
About This Home
This home is located at 54 Colony Rd, Lexington, MA 02420 and is currently estimated at $2,974,189, approximately $1,603 per square foot. 54 Colony Rd is a home located in Middlesex County with nearby schools including Fiske Elementary School, William Diamond Middle School, and Lexington High School.
Ownership History
Date
Name
Owned For
Owner Type
Purchase Details
Closed on
Jan 10, 2023
Sold by
Lynch Paul S and Lynch Karen L
Bought by
54 Colony Road Nt
Current Estimated Value
Purchase Details
Closed on
May 13, 2008
Sold by
Baker Sharon A and Burgard Stephen D
Bought by
Lynch Karen L and Lynch Paul S
Home Financials for this Owner
Home Financials are based on the most recent Mortgage that was taken out on this home.
Original Mortgage
$417,000
Interest Rate
5.93%
Mortgage Type
Purchase Money Mortgage
Purchase Details
Closed on
Dec 28, 2006
Sold by
Baker Sharon A
Bought by
Baker Sharon A and Burgard Stephen D
Purchase Details
Closed on
Aug 16, 2004
Sold by
Sakore Manisha P and Shah Paresh C
Bought by
Baker Sharon A
Home Financials for this Owner
Home Financials are based on the most recent Mortgage that was taken out on this home.
Original Mortgage
$450,000
Interest Rate
6.16%
Mortgage Type
Purchase Money Mortgage
Purchase Details
Closed on
May 19, 2003
Sold by
Barbara A Estey T
Bought by
Sakore Manisha P and Shah Paresh C
Home Financials for this Owner
Home Financials are based on the most recent Mortgage that was taken out on this home.
Original Mortgage
$591,200
Interest Rate
5.84%
Mortgage Type
Purchase Money Mortgage
Create a Home Valuation Report for This Property
The Home Valuation Report is an in-depth analysis detailing your home's value as well as a comparison with similar homes in the area
Home Values in the Area
Average Home Value in this Area
Purchase History
| Date | Buyer | Sale Price | Title Company |
|---|---|---|---|
| 54 Colony Road Nt | -- | None Available | |
| Lynch Karen L | $850,000 | -- | |
| Baker Sharon A | -- | -- | |
| Baker Sharon A | $755,000 | -- | |
| Sakore Manisha P | $739,000 | -- |
Source: Public Records
Mortgage History
| Date | Status | Borrower | Loan Amount |
|---|---|---|---|
| Previous Owner | Lynch Karen L | $417,000 | |
| Previous Owner | Baker Sharon A | $450,000 | |
| Previous Owner | Sakore Manisha P | $591,200 |
Source: Public Records
Tax History Compared to Growth
Tax History
| Year | Tax Paid | Tax Assessment Tax Assessment Total Assessment is a certain percentage of the fair market value that is determined by local assessors to be the total taxable value of land and additions on the property. | Land | Improvement |
|---|---|---|---|---|
| 2025 | $38,207 | $3,124,000 | $951,000 | $2,173,000 |
| 2024 | $35,133 | $2,868,000 | $906,000 | $1,962,000 |
| 2023 | $32,370 | $2,490,000 | $824,000 | $1,666,000 |
| 2022 | $32,306 | $2,341,000 | $749,000 | $1,592,000 |
| 2021 | $9,166 | $2,182,000 | $743,000 | $1,439,000 |
| 2020 | $31,725 | $2,258,000 | $743,000 | $1,515,000 |
| 2019 | $30,429 | $2,155,000 | $708,000 | $1,447,000 |
| 2018 | $8,166 | $2,058,000 | $674,000 | $1,384,000 |
| 2017 | $28,893 | $1,994,000 | $642,000 | $1,352,000 |
| 2016 | $29,536 | $2,023,000 | $660,000 | $1,363,000 |
| 2015 | $28,620 | $1,926,000 | $600,000 | $1,326,000 |
| 2014 | $27,546 | $1,776,000 | $537,000 | $1,239,000 |
Source: Public Records
Map
Nearby Homes
- 36 Adams St
- 3 Brown Rd
- 12 Coolidge Ave
- 1 Maureen Rd
- 45 Hancock St
- 6 Maureen Rd
- 30 Meriam St Unit 30
- 32 Edgewood Rd Unit 1
- 23 Burroughs Rd
- 23 Thoreau Rd
- 71 Webb St
- 93 Bedford St Unit 201
- 93 Bedford St Unit 308
- 93 Bedford St Unit 101
- 17 Hamilton Rd
- 103 N Hancock St
- 162 North St
- 1894 Massachusetts Ave
- 3a Nowers Rd
- 25 Flintlock Rd
- 38 Colony Rd
- 3 Wisteria Ln
- 36 Colony Rd
- 62 Colony Rd
- 49 Colony Rd
- 7 Wisteria Ln
- 5 Wisteria Ln
- 53 Colony Rd
- 57 Colony Rd
- 63 Colony Rd
- 66 Colony Rd
- 39 Colony Rd
- 65 Colony Rd
- 34 Colony Rd
- 21 Seaborn Place
- 68 Colony Rd
- CL Lexington Courtyard Unit 1
- CR Lexington Courtyard Unit 1
- CR Lexington Courtyard Unit 11
- CR Lexington Courtyard Unit 2