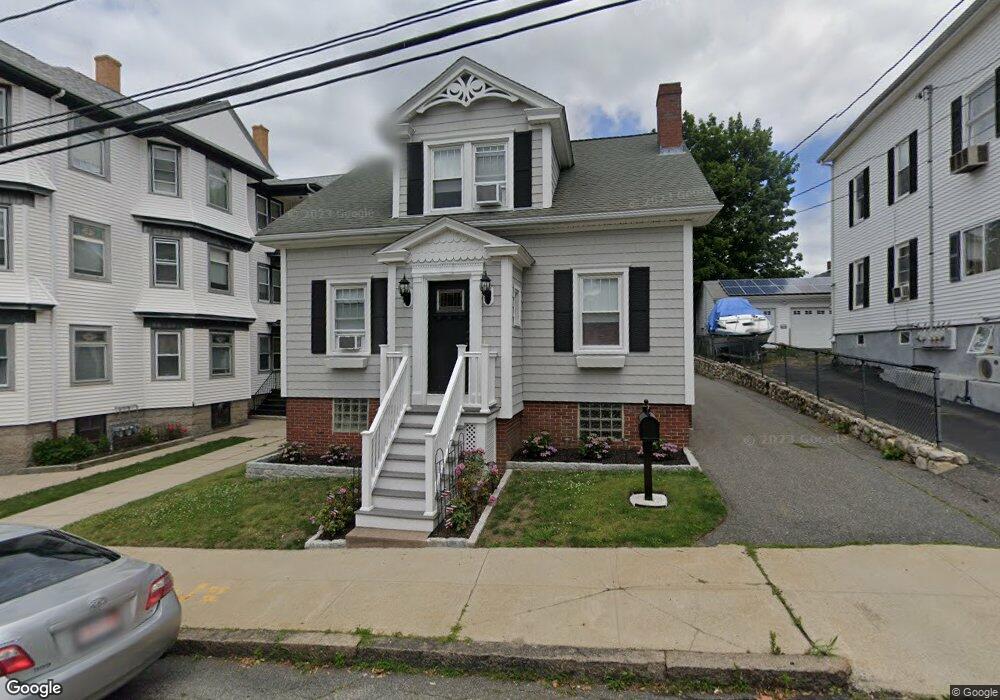
54 Conant St Fall River, MA 02724
Father Kelly NeighborhoodEstimated Value: $360,475 - $418,000
2
Beds
2
Baths
1,416
Sq Ft
$273/Sq Ft
Est. Value
About This Home
This home is located at 54 Conant St, Fall River, MA 02724 and is currently estimated at $386,869, approximately $273 per square foot. 54 Conant St is a home located in Bristol County with nearby schools including Henry Lord Community School, B M C Durfee High School, and Argosy Collegiate Charter School.
Ownership History
Date
Name
Owned For
Owner Type
Purchase Details
Closed on
Mar 25, 1994
Sold by
Tansey Arthur M and Tansey Denise Dion
Bought by
Arruda Mark A and Arruda Mary Anna
Current Estimated Value
Purchase Details
Closed on
Jul 20, 1989
Sold by
Jones Earl H
Bought by
Tansey Arthur M
Create a Home Valuation Report for This Property
The Home Valuation Report is an in-depth analysis detailing your home's value as well as a comparison with similar homes in the area
Home Values in the Area
Average Home Value in this Area
Purchase History
| Date | Buyer | Sale Price | Title Company |
|---|---|---|---|
| Arruda Mark A | $118,000 | -- | |
| Tansey Arthur M | $115,000 | -- | |
| Tansey Arthur M | $115,000 | -- |
Source: Public Records
Mortgage History
| Date | Status | Borrower | Loan Amount |
|---|---|---|---|
| Closed | Tansey Arthur M | $93,000 | |
| Closed | Tansey Arthur M | $140,000 | |
| Closed | Tansey Arthur M | $135,000 |
Source: Public Records
Tax History
| Year | Tax Paid | Tax Assessment Tax Assessment Total Assessment is a certain percentage of the fair market value that is determined by local assessors to be the total taxable value of land and additions on the property. | Land | Improvement |
|---|---|---|---|---|
| 2025 | $3,535 | $308,700 | $107,600 | $201,100 |
| 2024 | $3,334 | $290,200 | $103,600 | $186,600 |
| 2023 | $3,077 | $250,800 | $85,600 | $165,200 |
| 2022 | $2,887 | $228,800 | $81,500 | $147,300 |
| 2021 | $2,718 | $196,500 | $77,600 | $118,900 |
| 2020 | $2,748 | $190,200 | $76,400 | $113,800 |
| 2019 | $2,648 | $181,600 | $73,600 | $108,000 |
| 2018 | $2,601 | $177,900 | $79,700 | $98,200 |
| 2017 | $2,428 | $173,400 | $76,000 | $97,400 |
| 2016 | $2,365 | $173,500 | $80,800 | $92,700 |
| 2015 | $2,269 | $173,500 | $80,800 | $92,700 |
| 2014 | $2,154 | $171,200 | $78,500 | $92,700 |
Source: Public Records
Map
Nearby Homes
Your Personal Tour Guide
Ask me questions while you tour the home.