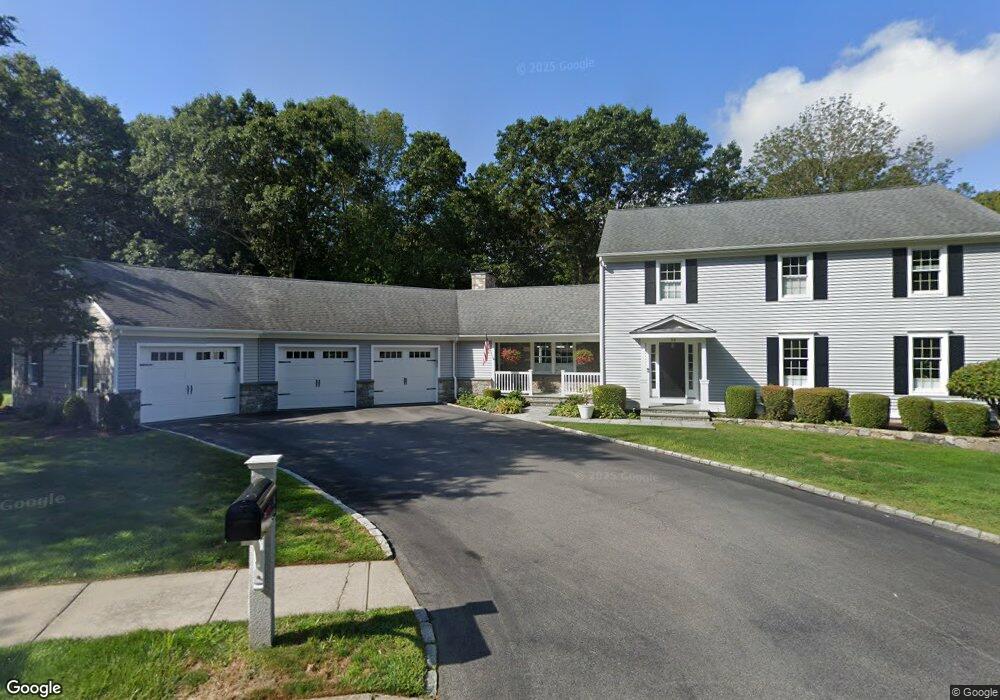
54 Contour Rd Warwick, RI 02886
Cowesett NeighborhoodEstimated Value: $713,493 - $867,000
4
Beds
3
Baths
2,740
Sq Ft
$285/Sq Ft
Est. Value
About This Home
This home is located at 54 Contour Rd, Warwick, RI 02886 and is currently estimated at $780,123, approximately $284 per square foot. 54 Contour Rd is a home located in Kent County with nearby schools including Our Lady of Mercy School.
Ownership History
Date
Name
Owned For
Owner Type
Purchase Details
Closed on
Aug 28, 2024
Sold by
Pardy James A
Bought by
Disegna Ross P and Pardy Nicholas J
Current Estimated Value
Home Financials for this Owner
Home Financials are based on the most recent Mortgage that was taken out on this home.
Original Mortgage
$425,000
Outstanding Balance
$419,706
Interest Rate
6.77%
Mortgage Type
Purchase Money Mortgage
Estimated Equity
$360,417
Purchase Details
Closed on
Dec 1, 2015
Sold by
Gavitt Arlene C
Bought by
Pardy James A
Purchase Details
Closed on
Feb 20, 1991
Sold by
Potts Stephen M
Bought by
Pardy James A
Purchase Details
Closed on
Aug 7, 1990
Sold by
W M Bldg Inc
Bought by
Potts Stephen M
Create a Home Valuation Report for This Property
The Home Valuation Report is an in-depth analysis detailing your home's value as well as a comparison with similar homes in the area
Home Values in the Area
Average Home Value in this Area
Purchase History
| Date | Buyer | Sale Price | Title Company |
|---|---|---|---|
| Disegna Ross P | $650,000 | None Available | |
| Disegna Ross P | $650,000 | None Available | |
| Pardy James A | $335,000 | -- | |
| Pardy James A | $317,000 | -- | |
| Potts Stephen M | $319,000 | -- | |
| Pardy James A | $335,000 | -- | |
| Pardy James A | $317,000 | -- | |
| Potts Stephen M | $319,000 | -- |
Source: Public Records
Mortgage History
| Date | Status | Borrower | Loan Amount |
|---|---|---|---|
| Open | Disegna Ross P | $425,000 | |
| Closed | Disegna Ross P | $425,000 | |
| Previous Owner | Potts Stephen M | $471,750 | |
| Previous Owner | Potts Stephen M | $263,670 |
Source: Public Records
Tax History Compared to Growth
Tax History
| Year | Tax Paid | Tax Assessment Tax Assessment Total Assessment is a certain percentage of the fair market value that is determined by local assessors to be the total taxable value of land and additions on the property. | Land | Improvement |
|---|---|---|---|---|
| 2025 | $9,126 | $718,600 | $183,100 | $535,500 |
| 2024 | $9,854 | $681,000 | $159,100 | $521,900 |
| 2023 | $9,663 | $681,000 | $159,100 | $521,900 |
| 2022 | $9,693 | $517,500 | $115,600 | $401,900 |
| 2021 | $9,693 | $517,500 | $115,600 | $401,900 |
| 2020 | $9,693 | $517,500 | $115,600 | $401,900 |
| 2019 | $9,693 | $517,500 | $115,600 | $401,900 |
| 2018 | $10,223 | $491,500 | $138,900 | $352,600 |
| 2017 | $9,948 | $491,500 | $138,900 | $352,600 |
| 2016 | $9,746 | $481,500 | $138,900 | $342,600 |
| 2015 | $8,908 | $429,300 | $117,500 | $311,800 |
| 2014 | $8,612 | $429,300 | $117,500 | $311,800 |
| 2013 | $8,496 | $429,300 | $117,500 | $311,800 |
Source: Public Records
Map
Nearby Homes
- 78 Timberline Rd
- 199 Love Ln
- 185 Joseph Ct
- 121 Hedgerow Dr
- 45 Country Ln
- 155 Birkshire Dr
- 181 Highland Ave
- 527 Cowesett Rd
- 189 Cowesett Rd
- 16 Taylor Ln
- 107 Viceroy Rd
- 6 Island View Dr
- 3800 Post Rd Unit 4
- 21 Crestwood Rd
- 3940 Post Rd Unit 3
- 3976 Post Rd
- 66 Dagnillo Dr
- 17 Wampum Dr
- 180 Boulder View Dr
- 151 Drum Rock Ave
- 126 Contour Rd
- 68 Contour Rd
- 48 Contour Rd
- 65 Contour Rd
- 81 Contour Rd
- 1 Lisa Marie Cir
- 2 Lisa Marie Cir
- 1 N Winnisquam Dr
- 33 Contour Rd
- 77 Contour Rd
- 15 Lisa Marie Cir
- 2 N Winnisquam Dr
- 17 Contour Rd
- 2 Macera Cir
- 85 Peacock Rd
- 94 Peacock Rd
- 3 Macera Cir
- 16 Lisa Marie Cir
- 8 N Winnisquam Dr
- 12 Pasco Cir