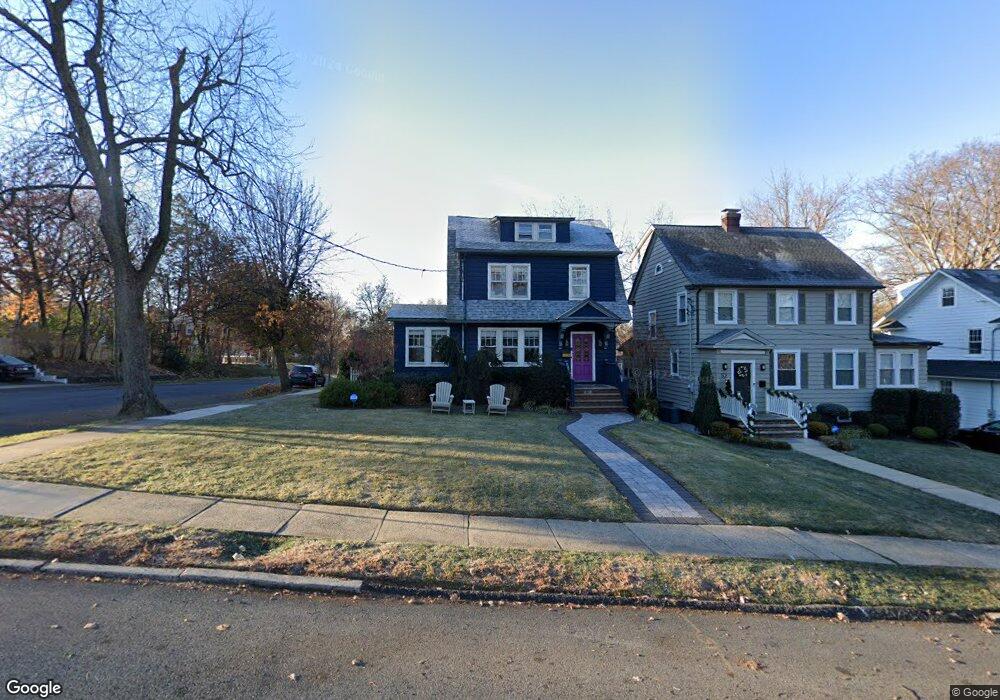
54 Courter Ave Maplewood, NJ 07040
Estimated Value: $971,241 - $1,159,000
--
Bed
--
Bath
1,987
Sq Ft
$538/Sq Ft
Est. Value
About This Home
This home is located at 54 Courter Ave, Maplewood, NJ 07040 and is currently estimated at $1,068,810, approximately $537 per square foot. 54 Courter Ave is a home located in Essex County with nearby schools including Tuscan Elementary School, Maplewood Middle School, and Columbia Senior High School.
Ownership History
Date
Name
Owned For
Owner Type
Purchase Details
Closed on
Jul 19, 1994
Sold by
Erwin Dana
Bought by
Schachter Ephraim and Schachter Susan
Current Estimated Value
Home Financials for this Owner
Home Financials are based on the most recent Mortgage that was taken out on this home.
Original Mortgage
$160,000
Interest Rate
8.52%
Purchase Details
Closed on
Oct 19, 1989
Sold by
Dubois Steven G and Dubois Elizabeth A
Bought by
Erwin Dana M and Erwin Sara
Purchase Details
Closed on
Jul 29, 1988
Sold by
Akers George E
Bought by
Dubois Steven G
Create a Home Valuation Report for This Property
The Home Valuation Report is an in-depth analysis detailing your home's value as well as a comparison with similar homes in the area
Home Values in the Area
Average Home Value in this Area
Purchase History
| Date | Buyer | Sale Price | Title Company |
|---|---|---|---|
| Schachter Ephraim | $220,000 | -- | |
| Erwin Dana M | $237,500 | -- | |
| Dubois Steven G | $255,000 | -- |
Source: Public Records
Mortgage History
| Date | Status | Borrower | Loan Amount |
|---|---|---|---|
| Closed | Schachter Ephraim | $160,000 |
Source: Public Records
Tax History Compared to Growth
Tax History
| Year | Tax Paid | Tax Assessment Tax Assessment Total Assessment is a certain percentage of the fair market value that is determined by local assessors to be the total taxable value of land and additions on the property. | Land | Improvement |
|---|---|---|---|---|
| 2025 | $19,400 | $873,000 | $436,400 | $436,600 |
| 2024 | $19,400 | $873,000 | $436,400 | $436,600 |
| 2022 | $18,917 | $536,500 | $295,000 | $241,500 |
| 2021 | $17,604 | $514,900 | $295,000 | $219,900 |
| 2020 | $17,105 | $514,900 | $295,000 | $219,900 |
| 2019 | $16,611 | $514,900 | $295,000 | $219,900 |
| 2018 | $16,183 | $514,900 | $295,000 | $219,900 |
| 2017 | $15,699 | $514,900 | $295,000 | $219,900 |
| 2016 | $16,417 | $445,500 | $262,500 | $183,000 |
| 2015 | $16,038 | $445,500 | $262,500 | $183,000 |
| 2014 | $15,699 | $445,500 | $262,500 | $183,000 |
Source: Public Records
Map
Nearby Homes
- 14 Rutgers St
- 26 Colgate Rd
- 44 Oberlin St
- 27 Tuscan St
- 60 Bowdoin St
- 34 Lancaster Ave
- 18 Boyden Pkwy S
- 188 Burnett Ave
- 551 Prospect St
- 11 Oakview Ave
- 61 Concord Ave
- 72 Concord Ave
- 74 Hughes St
- 23 Kensington Terrace
- 6 Field Rd
- 168 Jacoby St
- 29 Schaefer Rd
- 56 Broadview Ave
- 37 Menzel Ave
- 74 Meadowbrook Place Unit C0074