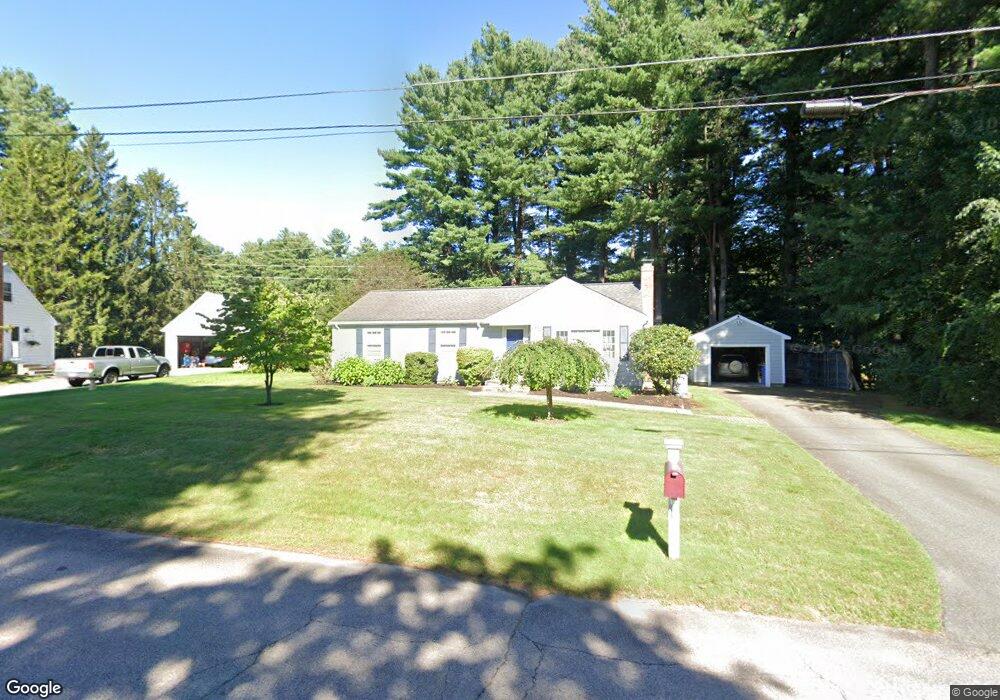
54 Cranberry Ln Holliston, MA 01746
Estimated Value: $680,000 - $767,242
3
Beds
2
Baths
2,490
Sq Ft
$287/Sq Ft
Est. Value
About This Home
This home is located at 54 Cranberry Ln, Holliston, MA 01746 and is currently estimated at $715,561, approximately $287 per square foot. 54 Cranberry Ln is a home located in Middlesex County with nearby schools including Miller Elementary School, Robert H. Adams Middle School, and Holliston High School.
Ownership History
Date
Name
Owned For
Owner Type
Purchase Details
Closed on
Dec 10, 2024
Sold by
Marrazzo Joseph V and Marrazzo Stephanie D
Bought by
Marrazzo Ft and Marrazzo
Current Estimated Value
Purchase Details
Closed on
Sep 1, 2006
Sold by
Deady Ralph
Bought by
Marrazzo Joseph and Mahoney Stephanie D
Home Financials for this Owner
Home Financials are based on the most recent Mortgage that was taken out on this home.
Original Mortgage
$316,000
Interest Rate
6.83%
Mortgage Type
Purchase Money Mortgage
Purchase Details
Closed on
Apr 28, 2004
Sold by
Deady Ralph and Deveau Susan M
Bought by
Deady Ralph
Purchase Details
Closed on
Feb 28, 2002
Sold by
Willis Luella F
Bought by
Deady Ralph
Home Financials for this Owner
Home Financials are based on the most recent Mortgage that was taken out on this home.
Original Mortgage
$155,000
Interest Rate
6.85%
Mortgage Type
Purchase Money Mortgage
Create a Home Valuation Report for This Property
The Home Valuation Report is an in-depth analysis detailing your home's value as well as a comparison with similar homes in the area
Home Values in the Area
Average Home Value in this Area
Purchase History
| Date | Buyer | Sale Price | Title Company |
|---|---|---|---|
| Marrazzo Ft | -- | None Available | |
| Marrazzo Ft | -- | None Available | |
| Marrazzo Ft | -- | None Available | |
| Marrazzo Joseph | $395,000 | -- | |
| Deady Ralph | -- | -- | |
| Marrazzo Joseph V | $395,000 | -- | |
| Deady Ralph | -- | -- | |
| Deady Ralph | $272,000 | -- |
Source: Public Records
Mortgage History
| Date | Status | Borrower | Loan Amount |
|---|---|---|---|
| Previous Owner | Deady Ralph | $307,000 | |
| Previous Owner | Marrazzo Joseph | $316,000 | |
| Previous Owner | Deady Ralph | $155,000 |
Source: Public Records
Tax History Compared to Growth
Tax History
| Year | Tax Paid | Tax Assessment Tax Assessment Total Assessment is a certain percentage of the fair market value that is determined by local assessors to be the total taxable value of land and additions on the property. | Land | Improvement |
|---|---|---|---|---|
| 2025 | $10,261 | $700,400 | $260,200 | $440,200 |
| 2024 | $9,339 | $620,100 | $260,200 | $359,900 |
| 2023 | $9,380 | $609,100 | $260,200 | $348,900 |
| 2022 | $8,798 | $506,200 | $260,200 | $246,000 |
| 2021 | $8,739 | $489,600 | $238,700 | $250,900 |
| 2020 | $8,696 | $461,300 | $236,800 | $224,500 |
| 2019 | $8,065 | $428,300 | $206,000 | $222,300 |
| 2018 | $7,996 | $428,300 | $206,000 | $222,300 |
| 2017 | $7,199 | $388,700 | $198,200 | $190,500 |
| 2016 | $6,838 | $363,900 | $173,400 | $190,500 |
| 2015 | $6,758 | $348,700 | $156,000 | $192,700 |
Source: Public Records
Map
Nearby Homes
- 6 Brook St
- 195 High St
- 131 Jennings Rd
- 151 Mohawk Path
- 56 Roy Ave
- 11 Francine Dr
- 133 Brooksmont Dr Unit 43
- 95 Brooksmont Dr Unit 26
- 32 Colonial Way
- 54 Westfield Dr
- 121 Bullard St
- 160 Winter St
- 61 Old Orchard Rd
- 30 Powderhorn Ln
- 156 Mitchell Rd
- 150 Westfield Dr
- 20 Nason Hill Rd
- 59 Turner Rd
- 1366 Washington St
- 43 Bittersweet Cir Unit 43
- 50 Cranberry Ln
- 58 Cranberry Ln
- 59 Cranberry Ln
- 62 Cranberry Ln
- 46 Cranberry Ln
- 55 Cranberry Ln
- 65 Cranberry Ln
- 71 Cranberry Ln
- 66 Cranberry Ln
- 44 Cranberry Ln
- 28 Cranberry Ln
- 49 Cranberry Ln
- 45 Cranberry Ln
- 77 Cranberry Ln
- 70 Cranberry Ln
- 36 Cranberry Ln
- 41 Cranberry Ln
- 33 Cranberry Ln
- 16 Cranberry Ln
- 21 Cranberry Ln